

How AI Is Changing Prior Authorization in 2026?
How AI is changing prior authorization comes down to speed and accuracy. Software now reads chart data, checks payer rules, drafts requests, and flags gaps before submission. Trained staff still make the final call, and results vary by payer, tool, and workflow.
Prior authorization eats hours that practices never planned to spend. In the AMA’s 2025 survey, physicians averaged 40 requests every week. This guide shows how AI is changing prior authorization for practices and payers alike. You will see what the tools do, what CMS requires of payers, and where risks sit. A self-assessment checklist near the end lets you score your own process. Whether you run a family practice, an urgent care, or a multi-specialty group, the goal is the same. You want fewer stalled requests and more time for patients.
Key Numbers Cheat Sheet
| Metric | Practical Target/Range | Review Frequency | Primary Source |
| Requests per physician, weekly | Average of 40 (comparison only) | Quarterly | Named survey (AMA, 2025) |
| Payer decision time | 7 days standard; 72 hours expedited | Monthly, by payer | Published standard (CMS-0057-F) |
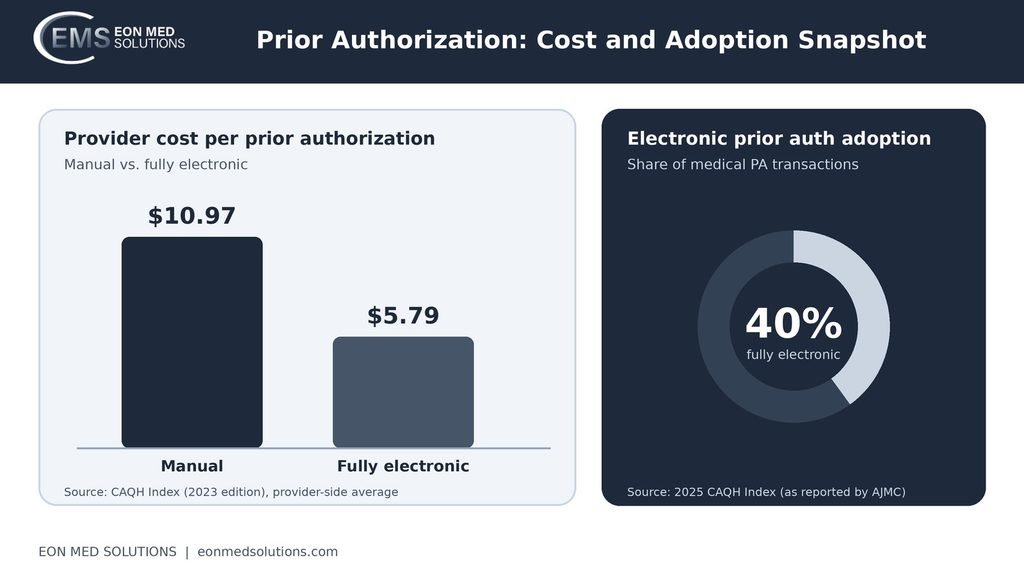
| Provider cost per request | $10.97 manual vs. $5.79 electronic | Annually | Named data provider (CAQH Index, 2023) |
| Fully electronic adoption | About 40% of transactions | Annually | Named data provider (CAQH Index, 2025) |
| First-pass approval rate | Illustrative: 85% or higher | Monthly | Illustrative target |
Source labels: published standard is a government rule; named survey is self-reported; named data provider is a benchmarking set; illustrative target is a planning figure, not an official benchmark.
Why Prior Authorization Became a Daily Bottleneck?
Prior authorization began as a cost-control check but now shapes daily workflow. The 2025 AMA survey of 1,000 physicians found an average of 40 requests per physician each week. Physicians and staff spent about 13 hours weekly on them, and 95% said the process delays necessary care. Nearly one in three said requests are often or always denied. These are self-reported answers, not audited denial rates. Even so, they explain why prior authorization automation and healthcare AI now top many administrators’ priority lists.
Where AI Actually Helps in the Request Lifecycle?
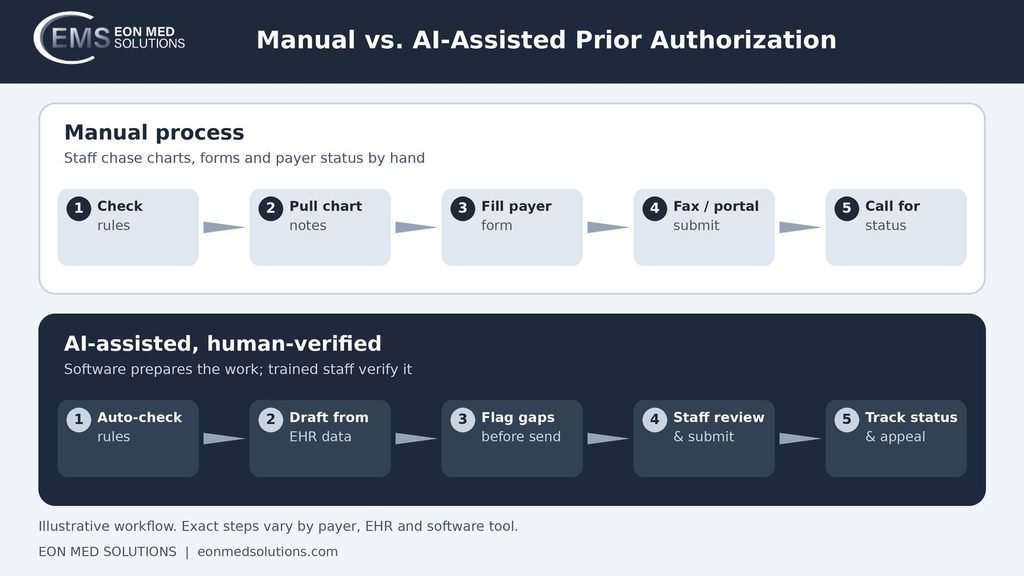
Most vendors describe AI as a single magic button. Here is how AI is changing prior authorization in reality: a set of narrow tools inside the request lifecycle. Generative AI drafts letters, summarizes chart notes, and writes appeals. Predictive AI estimates approval odds before you submit. Neither replaces the payer’s coverage criteria or human review. Be careful with vendor claims, since pages often quote approvals in seconds without naming a method. Ask for the payer list, specialty mix, and time period behind any figure.
Filling Forms and Checking Rules
Tools pull demographics, diagnosis codes, and notes from the record, then fill the payer’s form. This is where electronic prior authorization and EHR integration pay off, because clean data cuts rework. AI can also compare a draft against payer rules and flag gaps, such as a missing treatment history. That supports medical necessity documentation, where many avoidable denials begin. Treat any risk score as a prompt to review, not a verdict. A coder or nurse should still confirm that CPT and ICD-10 codes match the documented service.
Tracking Status and Drafting Appeals
After submission, the hard part is waiting for a decision. Automation can watch payer portals, log status changes, and alert staff before deadlines slip. Staff can then focus on exceptions instead of refreshing portals all day. When a request is denied, generative tools can draft an appeal that cites the payer’s reason and the chart evidence. A clinician should still review and sign each one. Tracking also builds data on turnaround by payer and repeat denial reasons. That turns scattered frustration into a denial management plan you can act on.
How AI Is Changing Prior Authorization on the Payer Side?
Insurers use automated tools too, to triage, approve, and sometimes deny requests. The AMA’s 2024 survey found that 61% of physicians feared this would raise denials. Six in ten still worried in 2025. Only 24% said medical necessity denials are consistently reviewed by a qualified clinician. Insurers dispute the concern, so evidence is mixed. According to KFF and law-firm summaries, some states, including Texas, limit automated denials that lack human review. Rules vary by state and plan, so track your own denials by payer.
Medicare’s WISeR Model
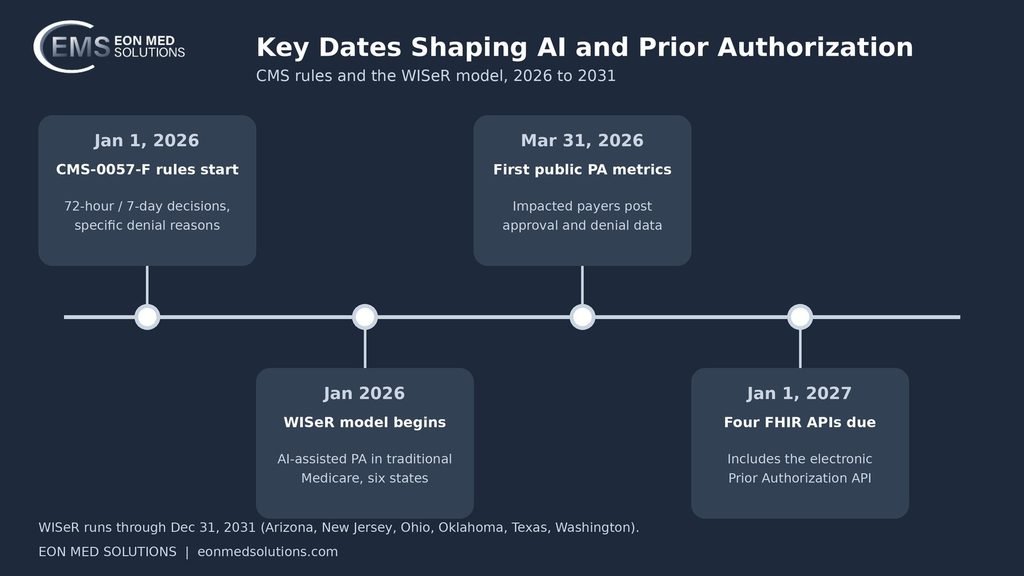
The clearest federal example is the WISeR model. CMS launched it on January 1, 2026, and it runs through 2031. It covers Arizona, New Jersey, Ohio, Oklahoma, Texas, and Washington. Technology vendors use AI and machine learning, paired with human clinical review, to assess selected traditional Medicare services. Providers may submit a request beforehand or accept prepayment review of the claim. CMS says the model does not change Medicare coverage policy. If your practice operates in one of these states, check the current service list before scheduling affected procedures.
What CMS Rules Mean for Your Practice in 2026 and 2027?
Understanding how AI is changing prior authorization also means knowing the rules around it. The CMS-0057-F final rule regulates payers rather than providers. Practices are not the regulated parties, but they benefit when payers comply. Since January 1, 2026, impacted payers must decide standard requests within seven calendar days. Expedited requests get 72 hours. Payers must also state a specific reason for each denial. Four FHIR-based APIs, including a Prior Authorization API, are due January 1, 2027. Impacted payers include Medicare Advantage and Medicaid programs, while marketplace plans follow different timing rules. The table below summarizes the dates.
| Date | Requirement (published standard) | What may change for you |
| Jan 1, 2026 | 72-hour and 7-day decisions; specific denial reasons | Faster answers, clearer appeals |
| Mar 31, 2026 | First public prior authorization metrics | Payer-to-payer comparisons |
| Jan 1, 2027 | Four FHIR APIs, including Prior Authorization | Electronic submission, where your EHR supports it |
So what should you do now? Record each payer’s actual turnaround on your requests, and document any missed window. Keep a simple log by payer, service, and date so patterns become visible. Read each denial reason closely, because specificity is now expected. Ask your EHR or clearinghouse vendor about its 2027 API plan. Share the log with your billing team. A healthy clean claim rate depends on authorizations being in place before the visit. This work supports broader clean claim rate improvement strategies.
The Math Behind Automation: Four Worked Examples
Numbers show whether a tool earns its cost. The CAQH Index is a named benchmarking program. Its 2023 edition reported provider costs of $10.97 for manual requests and $5.79 for fully electronic ones. Its 2025 edition put fully electronic adoption near 40%. Editions differ, so verify current figures before budgeting. The examples below use illustrative inputs, not client data. Treat every figure as context, not a guarantee. Rates and volumes differ widely by specialty. Time samples from your own staff beat guesses every time.
Example 1: Cost Per Request
Formula: Cost per request = (staff minutes ÷ 60) × loaded hourly rate
Worked example: Illustrative scenario (not an actual client record): 20 minutes at $28 per hour gives (20 ÷ 60) × $28 = $9.33.
Example 2: Monthly Workload Cost
Formula: Monthly cost = requests per month × cost per request
Worked example: At 120 requests, 120 × $9.33 = $1,120. If software cuts hands-on time to 8 minutes, cost falls to (8 ÷ 60) × $28 = $3.73, and 120 × $3.73 = $448. Illustrative saving: $672 a month, before software fees.
Example 3: First-Pass Approval Rate
Formula: First-pass approval rate = approved on first submission ÷ total submitted
Worked example: 99 approved out of 120 gives 99 ÷ 120 = 82.5%. The payer table below shows how that blended rate can mislead.
| Payer (illustrative) | Submitted | Approved first time | Rate |
| Payer A | 60 | 57 | 95% |
| Payer B | 30 | 15 | 50% |
| Payer C | 30 | 27 | 90% |
| Blended total | 120 | 99 | 82.5% |
Invented figures for illustration; verify against your own records.
Worked example: Payer B clears only half its requests, yet the blended rate hides it. Break every metric out by payer.
Example 4: Hours Recaptured
Formula: Hours recaptured = requests × minutes saved per request ÷ 60
Worked example: Saving 12 minutes on 120 requests gives 120 × 12 ÷ 60 = 24 hours a month.
Guardrails: HIPAA, Accuracy, and Human Oversight
AI tools handle protected health information, so HIPAA still applies. Before adopting a vendor, confirm a signed business associate agreement, encryption, access controls, and audit logs. Ask what data it keeps and whether it trains models on your records. Keep staff from pasting patient details into consumer chat tools. Accuracy matters too, because an unsupported statement in a request can create compliance exposure. Require human review of anything AI drafts, and add these steps to your medical billing compliance checklist.
How to Use These Numbers Correctly?
A benchmark helps only when you compare like with like. A cardiology group with heavy imaging requests will not resemble a primary care office. Match specialty, payer mix, size, and reporting period. Small differences in mix can change the picture. Survey averages, such as the AMA’s 40 requests a week, show scale but do not set your target. One missed number is a signal to investigate, not a verdict. Whenever you read claims about how AI is changing prior authorization, check them the same way.
Timeframe to Improvement
Improvement rarely happens overnight, and progress is uneven. The ranges below are general planning figures, not promises for any practice. Timing depends on payer mix, staffing, EHR capability, and request volume. Smaller practices may see partial results sooner because fewer systems need aligning. Treat the first quarter as a measurement period rather than a savings period. Expect some payers to respond faster than others. Document what you change and when. Then track the same metrics monthly so you can tell whether a change helped.
| Phase | Planning range | What you may see |
| Baseline and payer rule list | 2 to 4 weeks | Volume and denial reasons by payer |
| Templates and staff workflow | 1 to 3 months | Fewer requests returned for missing data |
| Tool setup and tuning | 3 to 6 months | Partial time savings, better approvals |
| Stable, measured performance | 6 to 12 months | Fuller gains, reliable payer trends |
Quick Summary
- How AI is changing prior authorization mostly means faster data gathering, checks, and tracking.
- Staff should review anything AI drafts.
- CMS-0057-F sets 72-hour and 7-day windows, a published standard.
- AMA and CAQH figures are named sources; 85% is illustrative.
- Compare like with like; one miss means investigate.
Self-Assessment Checklist
| # | Question | Yes / No |
| 1 | Do you know your weekly request volume? | ☐ Yes ☐ No |
| 2 | Have you sampled staff minutes per request this year? | ☐ Yes ☐ No |
| 3 | Do you calculate first-pass approval rate by payer? | ☐ Yes ☐ No |
| 4 | Do you compare payer decision times with the 7-day and 72-hour windows? | ☐ Yes ☐ No |
| 5 | Do you log the stated reason for every denial? | ☐ Yes ☐ No |
| 6 | Does a trained person review AI drafts before submission? | ☐ Yes ☐ No |
| 7 | Does every data-handling vendor have a signed business associate agreement? | ☐ Yes ☐ No |
| 8 | Do you review these metrics at least monthly? | ☐ Yes ☐ No |
| Yes answers | Tier | Next step |
| 7 to 8 | On track | Keep monitoring monthly. |
| 4 to 6 | Needs attention | Add payer-level tracking first. |
| 0 to 3 | Priority review | Build a baseline before adding tools. |
Expert Opinion
How AI is changing prior authorization is not a story of machines replacing people. Software absorbs repetitive work so staff can spend time on judgment, appeals, and patients. The tools help most when your process is already measured and documented. Where it is not, automation simply moves confusion faster. Treat AI as an assistant, not an authority. Every output still needs an accountable human reviewer. Hold vendors to the same standard: ask for evidence, not adjectives. Small, measured steps beat sweeping rollouts.
Be clear about which numbers carry real weight in this guide. The 72-hour and 7-day windows, the 2027 API date, and the WISeR dates are published standards from CMS. The AMA figures are named survey data, and the CAQH figures come from a named benchmarking set. The 85% first-pass figure, worked examples, and timeframe ranges are practical or illustrative targets, not official benchmarks. Numbers without labels invite poor decisions. Clear labels also build trust with partners and staff. Verify each against your own records.
Frequently Asked Questions
How AI is changing prior authorization: what does it mean for small practices?
It automates data entry, rule checks, and status tracking. Gains grow when staff review outputs and track results by payer.
What is AI prior authorization?
It uses machine learning and language models to prepare, submit, and track requests, usually with human verification.
Will AI replace prior authorization staff?
Current tools mostly assist people, and WISeR pairs AI with human clinical review. Roles are likelier to shift toward review.
What is a good first-pass approval rate for prior authorization?
No official benchmark exists. An internal target near 85% is illustrative only. Compare against your own baseline, by payer.
What is a good turnaround time for a prior authorization decision?
For impacted payers, CMS-0057-F sets 7 calendar days standard and 72 hours expedited. Some plan types differ.
What is a good amount of staff time per prior authorization request?
No single standard exists. The AMA reports about 13 weekly hours of physician and staff time, so sample your own minutes.
Can AI cause more prior authorization denials?
Many physicians worry it can, per AMA surveys, while insurers disagree. Log denials by payer to see your pattern.
Does CMS-0057-F apply to my practice?
It regulates payers such as Medicare Advantage and Medicaid programs. Practices feel it through faster decisions and clearer denial reasons.
When to Consider Professional Support?
Some signals suggest your in-house approach has hit its limit:
- One person owns authorizations, and requests stall when they are away.
- You cannot state your first-pass approval rate by payer.
- The same denial reasons return month after month.
When you look for outside support, focus on structure rather than promises. Useful traits include a US-based team, transparent reporting, and clear pricing without hidden fees. Look for HIPAA safeguards with a signed agreement and experience in your specialty. The partner should connect authorization work to billing, coding, and denial follow-up. Ask to see sample reports, and ask how human review fits each step. Pricing should be simple enough to explain in one sentence. Finally, confirm who is accountable when a request is denied or delayed.
EON MED SOLUTIONS is one company that fits that description. The company delivers medical billing, coding, credentialing, and revenue cycle management through a US-based team. Its emphasis is transparent reporting and no hidden fees. It serves urgent care, family practice, and multi-specialty groups. Its end-to-end approach connects billing, coding, credentialing, denial management, and compliance support, so authorization issues are not handled alone. Results vary by practice and situation. Review the full list of EON MED SOLUTIONS services to see what fits.
Sources and Methodology
- Published standards: CMS-0057-F fact sheet and CMS WISeR page.
- Named data provider: CAQH Index (2023 costs; 2025 adoption, via AJMC).
- Survey data: 2025 AMA Prior Authorization Physician Survey (1,000 physicians), May 13, 2026; AMA 2024 survey for 61%.
- Practical or illustrative targets: the 85% figure, examples, and timeframe ranges.
- State-law context: KFF and law-firm summaries. Vendor claims were not used. Results vary by practice; figures reflect information available in September 2026.


