

Improving Cash Flow Through Faster Claim Turnaround
Improving cash flow through faster claim turnaround means shortening every controllable day in the claim lifecycle — charge entry, coding, submission — so that once a claim reaches the payer, it starts a payment clock that’s already working in the practice’s favor. Payers operate under fixed processing windows regardless of how a claim was billed, so the only turnaround time a practice can actually shrink is the front-end lag before the claim ever reaches the payer, plus the accuracy that keeps it from bouncing back for rework.
Improving cash flow through faster claim turnaround-Cash flow problems in a medical practice rarely trace back to a single bad month of revenue. More often, the money was earned weeks or months ago and is simply still moving — sitting in an unsubmitted charge, a claim awaiting correction, or a payer’s processing queue. This guide covers where those days actually accumulate, which parts of the claim lifecycle a practice can control versus which are fixed by federal payment rules, and the benchmarks that separate a fast-moving claims process from a slow one. Near the end, you’ll find a short self-assessment checklist to score your own process against these numbers.
Key Numbers Cheat Sheet
Each figure below is unpacked further in this guide — bookmark this table as a quick reference rather than trying to absorb it all now.
| Metric | Practical Target/Range | Review Frequency | Primary Source |
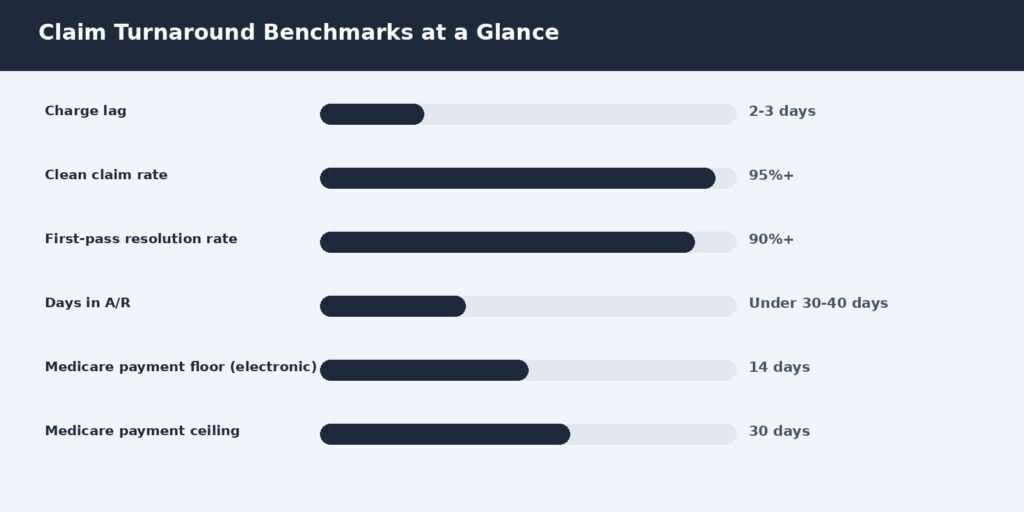
| Charge lag (service to charge entry) | Under 2–3 days | Weekly | Commonly reported industry range¹ |
| Clean claim rate | 95% or higher | Monthly | Commonly reported industry range¹ |
| First-pass resolution rate | 90% or higher | Monthly | Commonly reported industry range¹ |
| Days in A/R | Under 30–40 days | Weekly/Monthly | Commonly reported (MGMA/HFMA) range¹ |
| Medicare clean-claim payment floor (electronic) | 14 days after receipt | Per claim | Published federal standard² |
| Medicare clean-claim payment ceiling | 30 days after receipt (interest owed after) | Per claim | Published federal standard² |
¹ Commonly reported industry range = a figure cited consistently across multiple industry sources rather than one controlled study. ² Published federal standard = a codified CMS rule that applies to Medicare regardless of practice size or specialty, not a target a practice sets for itself.
What Claim Turnaround Actually Measures?
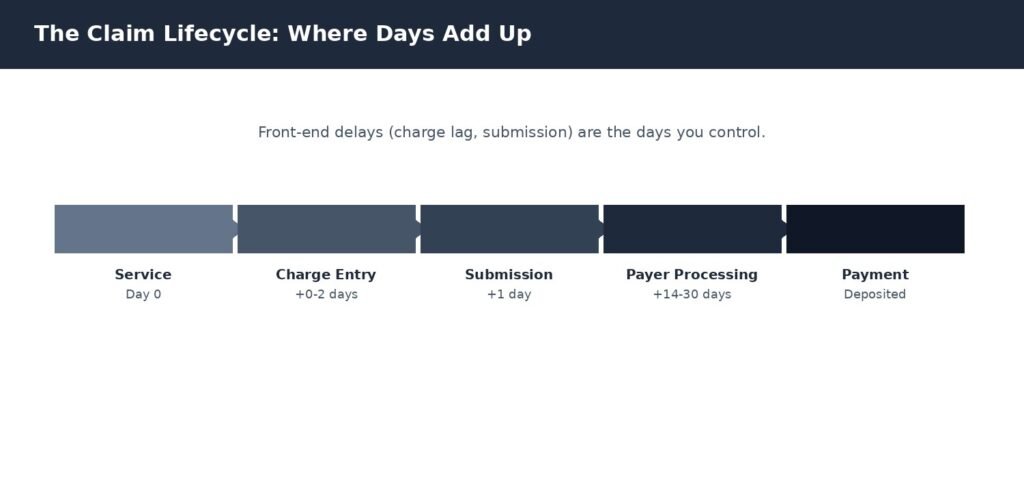
Claim turnaround is the total time between when a service is delivered and when payment is deposited, but that single number hides two very different phases. The first phase — service to submission — is almost entirely within a practice’s control: how quickly a charge gets entered, coded, and sent. The second phase — submission to payment — runs on the payer’s clock, governed by contract terms and, for Medicare, by federal regulation that doesn’t bend regardless of how efficient the practice’s front end is.
That distinction matters because it tells a practice where to actually focus. Chasing a payer to pay faster than its required processing window rarely works. Shrinking the days before the claim ever reaches the payer — and making sure it doesn’t bounce back for correction — is where turnaround time is genuinely recoverable.
Why Faster Turnaround Is a Cash Flow Lever, Not Just a Speed Metric?
A single day of charge lag, multiplied across every claim a practice submits in a month, adds up to a meaningful amount of revenue sitting outside the bank account at any given time. It’s not lost revenue in most cases — it’s delayed revenue, which still shows up eventually. But delayed revenue still has to be covered by something in the meantime: a line of credit, a cash reserve, or simply tighter margins on payroll and supply timing.
Practices that shrink front-end lag aren’t just getting paid faster on any single claim — they’re compressing the total dollar amount that’s perpetually in transit, which is what actually shows up as healthier cash flow month over month, independent of whether total revenue changed at all.
The Federal Floor: How Fast Payers Are Actually Required to Pay
For Medicare specifically, payment timing isn’t a courtesy — it’s regulated. CMS’s payment floor sets the earliest a clean claim can be paid, and the payment ceiling sets the deadline before interest is owed on a claim that isn’t paid or denied.
Per the Medicare Claims Processing Manual, electronic clean claims can’t be paid before day 14 after receipt, and paper clean claims can’t be paid before day 29. Both electronic and paper clean claims carry a 30-day payment ceiling, after which Medicare owes interest on the outstanding amount.
Medicare Clean-Claim Payment Timing
| Claim Type | Payment Floor (earliest payable) | Payment Ceiling (interest owed after) |
| Electronic clean claim | Day 14 after receipt | Day 30 after receipt |
| Paper clean claim | Day 29 after receipt | Day 30 after receipt |
Commercial payers generally aren’t bound by this exact schedule, but most operate under state prompt-payment laws with broadly similar windows — commonly 30 to 45 days for a clean claim, though the specific deadline and penalty structure vary by state and by payer contract.
Where Turnaround Time Actually Gets Lost?
Four points in the front-end process account for most avoidable delay: charge lag (the gap between service and charge entry), coding backlog (charges waiting on a coder or physician documentation), eligibility gaps (coverage issues caught at submission instead of check-in), and clearinghouse rejections (formatting or data errors caught before the claim even reaches the payer). Each one adds days before the payer’s clock even starts running.
Eligibility gaps in particular tend to resurface as coordination-of-benefits and denial problems downstream — a claim that goes out with stale coverage information doesn’t just delay payment, it often comes back denied entirely, restarting the clock from a much later date.
Clean Claims: The Single Biggest Lever
A clean claim is one that passes payer edits and is processed on first submission, with no missing data, coding errors, or documentation gaps that trigger a request for more information. Every claim that isn’t clean effectively restarts its own clock — corrected, resubmitted, and re-queued behind newer claims, often adding weeks rather than days.
Worked Example: Clean Claim Rate
Formula: Clean Claim Rate = Clean Claims ÷ Total Claims Submitted × 100. Example: 950 of 1,000 claims submitted in a month pass payer edits on first submission, giving 950 ÷ 1,000 = 95% — right at the commonly reported target. The 50 claims that didn’t pass are the ones adding the most days to average turnaround, disproportionate to their small share of total volume.
Clean claim rate has a close relative worth tracking separately: first-pass resolution rate, which measures the share of claims that resolve without any rework, appeal, or resubmission — a broader net than clean claim rate, since a claim can pass every pre-submission edit and still come back needing correction for a reason the scrub never checks, like a payer-specific documentation request.
Worked Example: First-Pass Resolution Rate
Formula: First-Pass Resolution Rate = Claims Resolved Without Rework ÷ Total Claims Submitted × 100. Example: a practice with a 95% clean claim rate finds only 88% of claims actually resolve without any follow-up action, meaning 7 percentage points’ worth of claims passed the pre-submission scrub but still needed rework after the fact — a signal the gap sits downstream, in payer-specific handling, documentation requests, or post-submission review, not in the scrub itself.
Electronic vs. Paper: The Turnaround Gap
Electronic claims aren’t just faster to process — they qualify for a shorter payment floor under Medicare rules, and most commercial payers process electronic submissions faster in practice even without a formal regulatory difference. Beyond claims themselves, broader adoption of electronic transactions — eligibility checks, claim status inquiries, remittance advice — compounds the effect, since each manual step in the surrounding workflow adds its own delay before a claim is even ready to submit.
The 2025 CAQH Index, the industry’s most comprehensive tracker of administrative automation, estimated that U.S. healthcare avoided $258 billion in administrative costs in 2024 through electronic transactions, while identifying roughly $21 billion in further savings still available from transactions that remain partly or fully manual — claim attachments among the slowest to digitize.
Electronic vs. Paper Claim Submission
| Factor | Paper Submission | Electronic Submission |
| Medicare payment floor | 29 days | 14 days |
| Typical processing speed (commercial) | Slower, manual data entry | Faster, automated matching |
| Error visibility before payer receipt | None — errors surface after mailing | Clearinghouse can flag before submission |
| Tracking | Manual follow-up required | Real-time status typically available |
Measuring Cash Flow Impact
The three calculations below use figures most billing teams already track. None takes more than a few minutes to run against your own claims data.
Worked Example: Charge Lag
Formula: Charge Lag = Charge Entry Date − Date of Service (in days), averaged across claims. Example: a practice’s charges are entered an average of 4 days after the visit, against a commonly reported 2–3 day target. Closing that 1–2 day gap alone can meaningfully shift how much revenue is perpetually in transit, without changing anything about actual collections performance.
Worked Example: Days in A/R
Formula: Days in A/R = Total Accounts Receivable ÷ Average Daily Charges. Example: a practice with $280,000 in total A/R and $8,000 in average daily charges has 280,000 ÷ 8,000 = 35 days in A/R — inside the commonly reported 30-to-40-day range, though closer to the upper edge worth monitoring.
Worked Example: Cash Tied Up in Front-End Delay
Formula: Estimated Cash in Transit from Front-End Delay = Average Daily Charges × Excess Charge Lag Days. Example: a practice billing $8,000 per day with a 4-day charge lag against a 2-day target has 2 excess days, meaning roughly $16,000 is perpetually sitting in unsubmitted charges at any given time — not lost, but unavailable until the backlog clears.
That figure isn’t just an accounting curiosity if the gap has to be covered by something. Illustrative example: if a practice draws on a line of credit at a hypothetical 8% annual interest rate to cover payroll during that gap, carrying $16,000 in perpetual excess delay costs roughly $16,000 × 8% ≈ $1,280 per year in interest that closing the charge-lag gap would have avoided entirely. The actual rate and whether a practice even uses credit varies, but the mechanism — idle cash has a carrying cost if it has to be backstopped — holds regardless of the specific numbers.
Why a Blended Average Can Hide a Real Problem?
A practice-wide clean claim rate or charge lag figure can look healthy while one service line or one biller’s queue quietly drags the whole cycle out. The table below is a hypothetical construct built to illustrate that methodology point — not figures pulled from any study or client record.
Illustrative Charge Lag by Service Line (Hypothetical Example)
| Service Line | Hypothetical Charge Lag | Note |
| Office visits (same-day coding) | ~1 day | Straightforward E/M coding |
| Procedures requiring op notes | ~3 days | Waiting on physician documentation |
| Specialty referrals | ~2 days | Additional coordination needed |
| Complex multi-provider cases | ~6 days | Documentation from multiple sources |
| Blended practice average | ~2.5 days | Masks the complex-case backlog |
Illustrative scenario (not an actual client record): a multi-provider practice reports a 2.5-day average charge lag and assumes the front end is running well. A service-line breakdown shows complex multi-provider cases sitting closer to 6 days, well outside the commonly reported 2–3 day target, hidden by the much faster office-visit volume that makes up most of total claims. The specific figures above are constructed to demonstrate this point, not sourced data. Actual figures vary by practice and specialty mix; verify against your own charge-entry log.
A quick caveat on reading a table like this one: the practice-wide 2–3 day target is a reasonable baseline, but individual service lines can reasonably run longer if the underlying documentation genuinely takes longer to complete. The useful question isn’t whether a service line matches the blended target — it’s whether that service line’s own lag has drifted beyond what its documentation complexity actually requires.
The same segmentation principle extends across the revenue cycle, not just within claim submission. A claim that reaches the payer faster but comes back denied hasn’t actually improved turnaround — it’s just moved the delay to a later, more expensive stage. That’s why charge lag and clean claim rate are only half the picture: they need to be paired with
denial management to catch what still gets denied despite a clean submission, and with accurate payment posting to make sure what comes back is applied correctly the first time — otherwise gains on the front end quietly leak out downstream.
How to Use These Numbers Correctly?
A benchmark here is only useful compared like-for-like. A practice heavy in same-day office visits will naturally post faster charge lag than one built around complex procedures with lengthy documentation, and comparing the two directly produces a misleading conclusion in either direction. Match service mix and claim complexity before drawing conclusions from a single figure.
One slow month is a signal to investigate, not a verdict on the whole process. Look for a pattern across two or three reporting periods, and check whether one service line, one payer, or one step in the workflow is driving the shift before assuming the entire claims process needs to change.
Timeframe to Improvement
None of these timeframes are fixed — how fast you move depends heavily on current claim volume, how standardized the front-end workflow already is, and how many service lines are involved.
| Change Made | What It Takes | Timeframe | Key Constraint |
| Move to same-day charge entry | Workflow change + staff scheduling | 1–2 wks rollout; 1 cycle to see impact | Physician documentation completion |
| Add claims scrubbing before submission | Software config + rule tuning | 2–4 weeks | Vendor timeline; parallel testing |
| Move remaining paper claims to electronic | Clearinghouse enrollment per payer | 4–8 weeks | Some payers still require paper |
| Address a service line’s coding backlog | Root-cause review + documentation fix | 2–3 billing cycles | Requires provider behavior change |
Quick Summary
- Focus turnaround improvement on the days before submission — that’s the only part of the clock a practice truly controls.
- Track charge lag (target: under 2–3 days) and clean claim rate (target: 95%+) as leading indicators, not just days in A/R.
- Medicare’s payment floor and ceiling are fixed by federal regulation — 14 days electronic, 30-day ceiling before interest is owed.
- Electronic submission isn’t just faster — it qualifies for a shorter payment floor and surfaces errors before the payer ever sees the claim.
- Check charge lag and clean claim rate by service line, not just the blended average — one complex service line can hide a real gap.
- A single slow month is a signal to investigate, not a reason to overhaul the entire claims process.
Self-Assessment Checklist
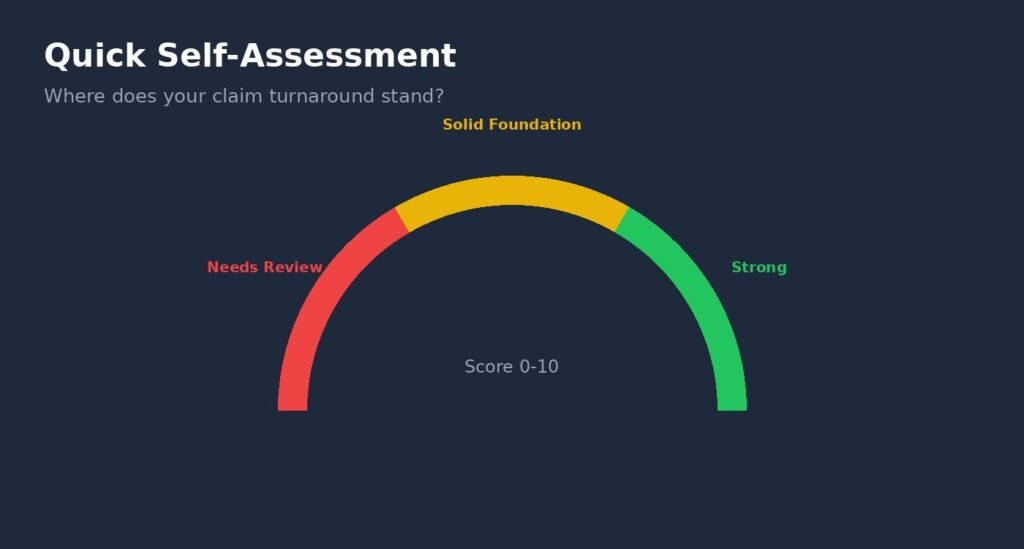
Answer yes or no to each question, then use the scoring guide below.
- Do you know your average charge lag, even roughly?
- Can you name your slowest-moving service line or claim type?
- Are charges entered within 2-3 days of the date of service?
- Do claims go through a scrubbing/edit check before submission?
- Is your clean claim rate at or above 95%, or do you know roughly where it stands?
- Are the vast majority of your claims submitted electronically?
- Do you track charge lag and clean claim rate separately from days in A/R?
- Is eligibility verified within a few days of the appointment, not just at initial scheduling?
- Do you review turnaround metrics by service line, not just as a practice-wide average?
- Do you have a documented target for charge entry timing that staff are held to?
Scoring guide:
- Score of 8–10: your claim turnaround process is running well — the job now is monitoring, not overhauling.
- Score of 4–7: the basics are in place, but there’s real room to tighten things up — start with whatever you answered “no” to.
- Score of 0–3: it’s worth mapping your claims turnaround process from charge entry through submission before anything else.
Expert Opinion
One thing trips up even disciplined practices: they measure days in A/R religiously, track it every month, and celebrate when it ticks down — while charge lag has quietly been creeping upward for half a year without anyone watching it. Days in A/R is a lagging indicator; by the time it moves, whatever caused the shift has already been compounding for weeks. Charge lag and clean claim rate are leading indicators — they show the problem while it’s still small enough to fix in a week, not a quarter.
The instinct when cash flow feels tight is to chase the payer harder — more follow-up calls, more escalations. That instinct usually targets the wrong half of the clock. Once a clean claim reaches Medicare, the payment floor and ceiling are fixed by regulation; no amount of follow-up moves day 14 earlier. The leverage sits upstream, in the days before submission, which is exactly the part of the process most practices measure the least.
That split shows up in the sourcing too: Medicare’s payment floor and ceiling are fixed federal standards, while charge lag, clean claim rate, and days in A/R figures are drawn from commonly reported industry ranges rather than a single controlled study. None of these numbers is a guarantee for any individual practice — service mix and claim complexity both shift what’s realistic.
— EON Med Solutions RCM Team
Frequently Asked Questions
Improving cash flow through faster claim turnaround
What does claim turnaround time mean in medical billing?
It’s the total time from when a service is delivered to when payment is deposited, split between the front-end days a practice controls (charge entry, coding, submission) and the payer-processing days governed by contract or regulation.
What is a good charge lag target?
Industry sources commonly report 2 to 3 days from date of service to charge entry as a practical target, with anything over about a week signaling a documentation or workflow bottleneck worth investigating.
What is a good clean claim rate?
A widely reported industry benchmark is 95% or higher on first submission, with top-performing practices reaching 97-99%. Below 90% generally points to a front-end problem — coding, eligibility, or documentation — rather than a payer issue.
How fast is Medicare required to pay a clean claim?
Federal regulation sets a payment floor of 14 days after receipt for electronic clean claims (29 days for paper) and a 30-day payment ceiling, after which interest is owed on the outstanding amount.
Does submitting claims electronically actually speed up payment?
Yes, in two ways: electronic clean claims qualify for a shorter Medicare payment floor than paper claims, and electronic submission surfaces formatting or data errors before the payer ever receives the claim, avoiding a much longer manual rework cycle.
What’s the difference between charge lag and days in A/R?
Charge lag measures the delay before a claim is even submitted; days in A/R measures how long it takes to collect after billing. A practice can have healthy days in A/R and still be losing cash flow to a hidden charge lag problem.
Can a practice speed up how fast a payer processes a claim?
Not directly — payer processing timelines are set by contract or, for Medicare, by federal regulation. The controllable lever is making sure the claim is clean and submitted quickly, since a clean claim starts the payer’s clock as early as possible.
What is a good first-pass resolution rate?
A commonly cited target is 90% or higher, meaning 9 in 10 claims resolve without requiring rework, appeal, or resubmission — a broader measure than clean claim rate since it also captures claims that were technically accepted but still needed correction.
When to Consider Professional Support?
Tightening internal workflows can only fix so much on its own. A handful of signals usually mean the underlying process needs outside help: charge lag creeping past a week for two consecutive cycles, clean claim rate stuck below 90%, a growing share of claims still going out on paper, or cash flow pressure that keeps recurring despite steady patient volume.
When those signals show up together, it usually means the front-end workflow hasn’t kept pace with claim volume or complexity — not that any single person or step failed on its own. At that point, practices generally look for support that treats charge capture, coding, and claim submission as one connected pipeline rather than separate handoffs each with their own backlog. That’s the structure worth looking for, whichever vendor or in-house process change ends up filling the gap.
It’s an approach EON Med Solutions builds around directly: claim submission speed, clean-claim quality, and denial management sit inside one connected revenue cycle process, so a claim moves from charge entry to submission without waiting on disconnected handoffs between teams. Every plan includes a dedicated RCM manager, and there are no long-term contracts. You can evaluate the fit without committing years upfront. Results vary by practice and claim mix. So the useful next step is comparing your own numbers against the benchmarks above, not taking anyone’s word for it.
If your self-assessment score above flagged more than one gap, reach out to EON Med Solutions. For a walkthrough of your current charge capture and submission workflow. The goal is a clear, specific list of where faster turnaround is realistic for your practice, not a generic pitch.
Sources & Methodology
- Published standards/regulations: Medicare clean-claim payment floor and ceiling (CMS Medicare Claims Processing Manual, Chapter 1, Section 80.2).
- Named benchmarking framework: HFMA’s MAP Keys initiative, which defines clean-claim and days-in-A/R metrics used consistently across the revenue cycle industry.
- Named industry index: the 2025 CAQH Index, the healthcare industry’s benchmark report on administrative transaction automation and associated cost/time savings.
- Commonly reported industry ranges: charge lag, clean claim rate, first-pass resolution rate, and days in A/R. Compiled from multiple industry sources rather than one named study.
- Illustrative targets: the service-line charge lag table, explicitly labeled as a hypothetical planning example rather than sourced data.
Actual results vary by practice, specialty, and claim mix. Figures in this article reflect information available at the time of research and should be verified against your own practice management or reporting system where precision matters.
Reference: CMS — Medicare Claims Processing Manual, Chapter 1 (Payment Floor/Ceiling Standards).
Ref: HFMA — MAP Keys, industry-standard revenue cycle KPIs.
Reference: CAQH — 2025 CAQH Index Report.
Related Reading on EON Med Solutions
Revenue Cycle Management services — how claim turnaround fits into the broader revenue cycle.
A/R Management — what happens to a claim after submission.
Denial Management — preventing the rework that erases turnaround gains.
Medical Billing KPIs to Track for Practices — a deeper look at the benchmarks referenced above.


