

Tracking Unpaid Claims Efficiently Across Payers
Tracking unpaid claims efficiently across payers means working from a payer-segmented worklist — not one blended aging report — so that each claim gets followed up before its specific timely filing deadline, using the age, dollar value, and payer of every open claim to decide what gets worked first. A single combined aging report can look healthy on average while one payer’s claims quietly age past the point of easy recovery, which is why the practical unit of tracking is the payer-specific worklist, not the practice-wide total.
Tracking unpaid claims efficiently across payers-A claim doesn’t become uncollectible all at once. It drifts there, a few unworked days at a time, usually because it was sitting in a blended aging report that looked fine in total while one specific payer’s claims quietly aged past the point of easy recovery. This guide covers how to track unpaid claims at the level that actually matters — by payer, not just by practice total — along with the deadlines that make delay expensive and the benchmarks that separate an aging report under control from one that’s quietly leaking revenue. Near the end, you’ll find a short self-assessment checklist to score your own process against these numbers.
Key Numbers Cheat Sheet
Each figure below is unpacked further in this guide — bookmark this table as a quick reference rather than trying to absorb it all now.
| Metric | Practical Target/Range | Review Frequency | Primary Source |
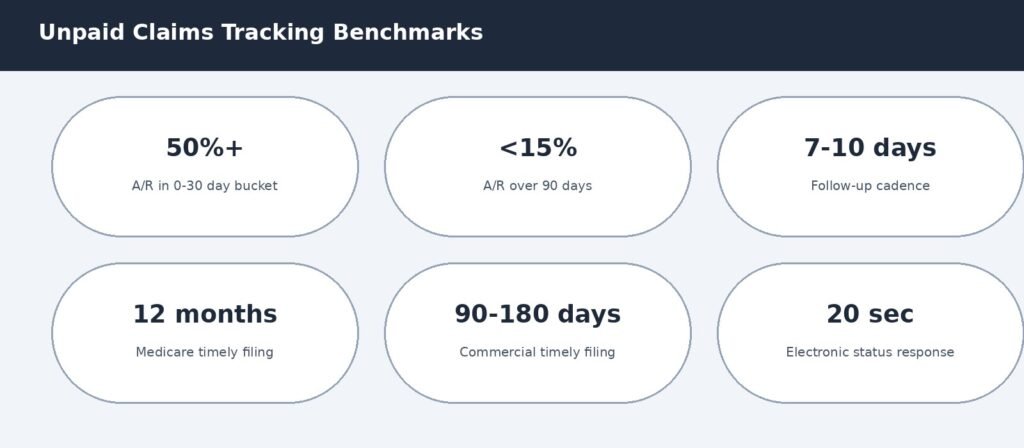
| Share of A/R in 0–30 day bucket | Over 50% of total A/R | Weekly | Commonly reported industry range¹ |
| Share of A/R over 90 days | Under ~15% (commonly cited 12–15%) | Weekly | Commonly reported (MGMA/HFMA) range¹ |
| Follow-up cadence per unpaid claim | Every 7–10 days | Per claim | Commonly reported industry practice |
| Medicare timely filing deadline | 12 months from date of service | Per claim | Published federal standard² |
| Commercial timely filing window | 90–180 days from date of service | Per claim | Payer-contract terms¹ |
| Electronic claim status response time | 20 seconds (90% of responses) | Per inquiry | Federally mandated operating rule² |
¹ Commonly reported industry range = a figure cited consistently across multiple industry sources rather than one controlled study. ² Published federal standard = a codified rule (CMS regulation or a federally mandated CAQH CORE operating rule), not a target a practice sets for itself.
What Efficient Tracking Actually Requires?
A practice-wide A/R aging report is the wrong starting unit for follow-up, even though it’s usually the first report anyone pulls. It answers “how much is outstanding” but not “which claim needs attention today,” because a blended total mixes payers with very different processing speeds, different timely filing clocks, and different odds of eventual payment. Efficient tracking means segmenting that same data by payer first, then by age and dollar value within each payer, so the worklist reflects which payer’s claims are actually at risk — not just which claims happen to be oldest in a combined list.
The reason this matters isn’t cosmetic. A claim worked at day 14 collects at a meaningfully higher rate than the same claim left untouched until day 90, and that gap compounds separately for every payer with its own timely filing window — a gap that a single combined report simply can’t show.
Why a Single Aging Report Isn’t Enough Across Multiple Payers?
Every payer runs its own clock: its own average processing speed, its own timely filing deadline, and its own pattern of what causes a claim to stall. A practice billing a dozen different payers is really managing a dozen different follow-up schedules at once, and a single combined aging report averages all of them into one number that doesn’t reflect any of them accurately.
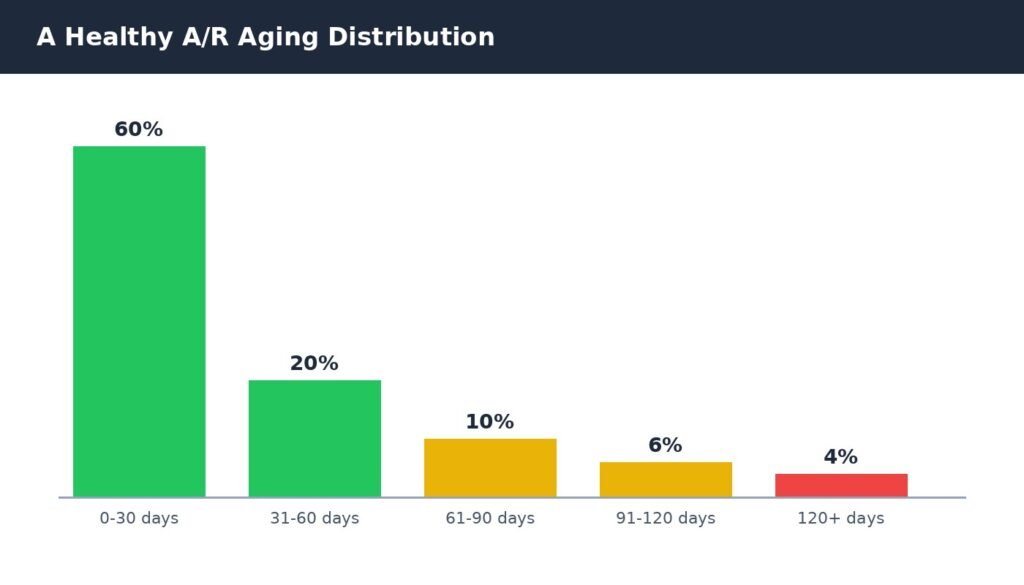
Standard A/R Aging Buckets
| Bucket | What It Typically Means |
| 0–30 days | Normal processing window — usually no action needed yet |
| 31–60 days | Follow-up window — confirm receipt and status |
| 61–90 days | Elevated risk — active follow-up required |
| 91–120 days | Priority queue — collection odds dropping meaningfully |
| 120+ days | Approaching or past filing deadlines for many payers — escalate immediately |
Building a Payer-by-Payer Worklist
The practical fix is straightforward even if it takes discipline to maintain: split the aging report by payer before anyone starts working it, and prioritize within each payer’s list by a combination of age and dollar value, not age alone. A $50 claim sitting at 70 days and a $4,000 claim sitting at 55 days aren’t equally urgent, even though the aging report alone would rank the older, smaller claim higher.
This is also where coordination-of-benefits claims need their own line item in the worklist — a secondary claim has its own timely filing clock that starts from the primary’s adjudication date, not the original date of service, and a payer-blended aging report will misrepresent how much runway that claim actually has left.
Electronic Claim Status: The Rule Most Practices Don’t Use
Checking claim status by phone is slow and inconsistent across payers, but most practices default to it anyway — often without realizing a faster, standardized alternative is federally required to exist. The 276/277 electronic claim status inquiry is a HIPAA transaction, and under CAQH CORE operating rules mandated by the Affordable Care Act, a covered payer must return a real-time response within 20 seconds for at least 90% of requests measured over a calendar month.
Per CAQH CORE’s published operating rules, that 20-second window covers the entire round trip — from the moment the request is submitted to the moment the response is delivered — regardless of how many systems the request passes through. A practice checking status by phone or payer portal one claim at a time is doing manually what this transaction is designed to do automatically, at a fraction of the staff time per claim.
Prioritizing the Worklist: Age, Dollar Value, and Deadline Proximity
Three factors should drive what gets worked first, and none of them alone is sufficient. Age matters because collection odds decline the longer a claim sits. Dollar value matters because a handful of high-value claims often represent more recoverable revenue than dozens of small ones. Deadline proximity matters most of all, because a claim that misses its timely filing window isn’t just delayed — it’s permanently unrecoverable, regardless of age or size.
Worked Example: Timely Filing Runway
A commercial payer allows 120 days from date of service to file. A claim submitted on day 5 is denied for a coding issue on day 40, corrected and resubmitted on day 48, but the correction itself is denied again on day 85 for a different reason. That leaves 120 − 85 = 35 days to resolve the second denial and get a clean claim in — workable, but only if that specific claim is flagged for immediate attention rather than sitting in a queue ranked purely by age.
The Clock That Actually Matters: Timely Filing Across Payers
Every follow-up strategy is ultimately racing a deadline, and that deadline is different for every payer. For Medicare specifically, the deadline is fixed by federal regulation, not contract or convention.
Under 42 CFR § 424.44, Medicare claims must be filed no later than one calendar year from the date of service, with only narrow exceptions for administrative error or retroactive eligibility determinations. Commercial payers set their own timely filing windows by contract, commonly 90 to 180 days, and those windows can vary meaningfully even among plans from the same carrier.
Timely Filing Windows by Payer Type
| Payer Type | Typical Timely Filing Window | Clock Starts From |
| Medicare (original claim) | 12 months (federal regulation) | Date of service |
| Commercial (most payers) | 90–180 days (contract-dependent) | Date of service |
| Secondary claims (any payer) | Often 90–180 days, sometimes shorter | Primary payer’s adjudication date |
| Medicaid (varies by state) | Commonly 90 days to 12 months | Date of service (state-specific) |
Measuring Follow-Up Efficiency
The three calculations below use figures most billing teams already track in their aging report. None takes more than a few minutes to run against your own data.
Worked Example: Share of A/R Over 90 Days
Formula: Share Over 90 Days = A/R Over 90 Days ÷ Total A/R × 100. Example: $18,000 of a practice’s $140,000 total A/R is aged past 90 days, giving 18,000 ÷ 140,000 ≈ 12.9% — inside the commonly reported 12–15% range, though worth watching if the trend is moving upward month over month.
Worked Example: Aging Bucket Distribution by Payer
Formula: no single formula — compare each payer’s own 0–30/31–60/61–90/90+ breakdown against the practice-wide distribution. Example: a practice’s blended distribution looks healthy at 58% in 0–30 days, but pulling one specific payer’s claims alone shows only 30% in 0–30 days and 25% over 90 — a payer-specific problem the blended number entirely conceals.
Worked Example: Follow-Up Touch Rate
Formula: Touch Rate = Claims With a Follow-Up Action Logged in the Last 10 Days ÷ Total Open Claims Over 30 Days × 100. Example: 340 of a practice’s 400 open claims over 30 days old have a logged follow-up action within the last 10 days, giving 340 ÷ 400 = 85% — meaning 60 claims, 15% of the aged worklist, haven’t been touched in over a week and are the most likely to be quietly drifting toward a missed deadline.
Why a Blended Total Can Hide a Real Problem?
A practice-wide A/R aging distribution can look healthy while one specific payer’s claims are quietly aging past recovery. The table below is a hypothetical construct built to illustrate that methodology point — not figures pulled from any study or client record.
Illustrative A/R Distribution by Payer (Hypothetical Example)
| Payer | Hypothetical Share in 0–30 Days | Hypothetical Share Over 90 Days |
| Medicare | ~68% | ~6% |
| Major commercial payer A | ~62% | ~9% |
| Major commercial payer B | ~55% | ~13% |
| Smaller regional payer | ~30% | ~28% |
| Blended practice average | ~58% | ~12% |
Illustrative scenario (not an actual client record): a practice’s blended A/R distribution looks solidly within target at 58% current and 12% aged past 90 days. A payer-level breakdown shows one smaller regional payer sitting at only 30% current and 28% aged past 90 — a real, specific problem hidden by strong performance from Medicare and the larger commercial payers that make up most of total claim volume. The specific figures above are constructed to demonstrate this point, not sourced data. Actual figures vary by practice and payer mix; verify against your own aging report segmented by payer.
How to Use These Numbers Correctly?
A benchmark here is only useful compared like-for-like. A practice with a payer mix heavy in standardized, fast-processing payers will naturally show a healthier blended aging distribution than one with several slow, non-standardized regional payers, and comparing the two directly produces a misleading conclusion. Match payer mix and claim volume before drawing conclusions from a single figure.
One slow month for one payer is a signal to investigate, not a verdict on the whole process. Look for a pattern across two or three reporting periods, and check whether one payer, one claim type, or one gap in follow-up cadence is driving the shift before assuming the entire tracking process needs to change.
Timeframe to Improvement
These are ballpark figures, not promises — actual timelines shift with current A/R volume, payer mix, and how much of the worklist is already segmented by payer.
| Change Made | What It Takes | Timeframe | Key Constraint |
| Segment the aging report by payer | Reporting/dashboard reconfiguration | 1–2 weeks | Practice management system’s reporting flexibility |
| Adopt electronic claim status checks (276/277) | Clearinghouse or portal enrollment per payer | 2–6 weeks, payer-dependent | Not all payers respond equally fast in practice |
| Build a payer-specific timely filing reference | One-time documentation effort | 1–2 weeks to build; ongoing to maintain | Requires tracking contract updates per payer |
| Establish a 7–10 day follow-up cadence | Workflow and staffing adjustment | 2–3 billing cycles to become routine | Requires consistent staff capacity, not just a policy |
Quick Summary
- Segment the aging report by payer before working it — a blended total hides which payer is actually at risk.
- Prioritize the worklist by age, dollar value, and deadline proximity together, not any one factor alone.
- Medicare’s 12-month timely filing deadline is fixed by federal regulation; commercial windows are typically 90–180 days by contract.
- Electronic claim status checks (276/277) are federally required to return a response within 20 seconds — most practices still check by phone anyway.
- Track share of A/R over 90 days (target: under ~15%) and follow-up touch rate as leading indicators of where the worklist is falling behind.
- A single slow payer can hide inside a healthy blended average — check distribution by payer, not just the practice-wide total.
Self-Assessment Checklist
Answer yes or no to each question, then use the scoring guide below.
- Do you know which single payer holds the largest share of your 90+ day A/R, even roughly?
- Is your aging report segmented by payer, not just reviewed as one blended total?
- Do you use electronic claim status checks (276/277) instead of relying mainly on phone calls?
- Does every open claim over 30 days have a logged follow-up action from the last 10 days?
- Do you prioritize the worklist by age, dollar value, and deadline proximity together?
- Do you have a documented timely filing reference for your top payers?
- Are secondary claims tracked with their own timely filing clock, separate from the original date of service?
- Is your share of A/R over 90 days at or below roughly 15%?
- Do high-dollar aged claims get flagged for priority attention, not just the oldest claims?
- Do you review aging distribution by payer monthly, not just when a problem is already visible?
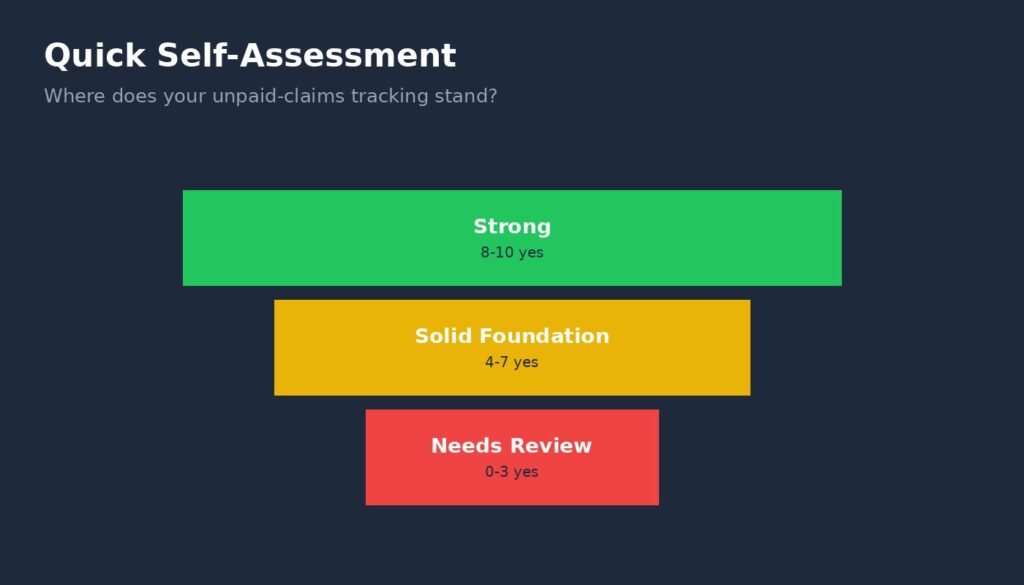
Scoring guide:
- 8–10 yes answers means your follow-up system on unpaid claims is in decent shape — the goal now is consistency, not a rebuild.
- 4–7 yes answers means claims are getting worked, just not systematically enough — start with whichever items you marked “no.”
- 0–3 yes answers is a sign unpaid claims are aging past timely filing windows before anyone catches them — worth addressing soon.
Expert Opinion
Here’s the trap that’s easy to fall into: a practice pulls its A/R aging report, sees a reasonable blended number, and moves on — while one specific payer’s claims have been quietly drifting toward their filing deadline the whole time, hidden inside an average that looks fine. The blended total isn’t wrong, exactly, it’s just answering the wrong question. “How much is outstanding” and “which claim needs attention today” are different questions, and only the second one actually keeps revenue from becoming unrecoverable.
Sourcing follows that same divide: Medicare’s timely filing deadline and the CAQH CORE claim status response rule are fix, publish federal standards, while aging bucket distribution and follow-up cadence are drawn from commonly reported industry ranges rather than a single controlled study. None of it is guarantee for any specific practice — payer mix and claim volume both shift what’s realistic.
The same segmentation principle connects directly to the rest of the revenue cycle: a claim that’s efficiently track but was never clean to begin with, or that comes back denial without anyone noticing, ends up back in the aging report regardless of how good the follow-up process is. Tracking unpaid claims well is necessary, but it works best paired with the upstream habits — clean claim submission, accurate payment posting, and prompt denial handling — that keep claims from becoming “unpaid” in the first place.— EON Med Solutions RCM Team
Frequently Asked Questions
Tracking unpaid claims efficiently across payers
What does it mean to track unpaid claims across payers?
It means working from a payer-segmented worklist rather than one blended aging report, so that each payer’s specific timely filing deadline and processing pattern is visible, rather than averaged away into a single practice-wide total.
What is a good share of A/R over 90 days?
Industry sources commonly cite under roughly 15% as a practical target, with figures above 20% generally signaling a systemic problem in claims accuracy, denial follow-up, or payer-specific handling rather than a one-off slow month.
How often should an unpaid claim be followed up on?
A commonly reported cadence is every 7 to 10 days per open claim, tightening as the claim approaches its specific timely filing deadline.
How long does Medicare allow for filing a claim?
Federal regulation (42 CFR § 424.44) requires Medicare claims to be file within 12 months of the date of service, with only narrow exceptions for administrative error or retroactive eligibility.
Why isn’t a blended aging report enough to manage unpaid claims?
Because it averages together payers with very different processing speeds and timely filing deadlines, a healthy-looking blended total can conceal one specific payer’s claims aging past the point of easy recovery.
What is the 276/277 transaction?
It’s the HIPAA-standard electronic claim status inquiry and response. Federally mandated CAQH CORE operating rules require a real-time response within 20 seconds for at least 90% of requests, though many practices still default to slower phone-based status checks.
Does a secondary claim have a different timely filing deadline than the original claim?
Yes. A secondary claim’s timely filing clock typically starts from the primary payer’s adjudication date, not the original date of service, which means it needs its own tracking rather than being lump in with primary claims by date of service.
How should a follow-up worklist be prioritized?
By a combination of claim age, dollar value, and proximity to the timely filing deadline together — ranking purely by age can mean a small, low-priority claim gets work ahead of a larger one that’s closer to becoming permanently unrecoverable.
When to Consider Professional Support?
A better worklist structure and follow-up discipline can only fix so much on their own. A handful of signals usually mean the underlying process needs outside help: share of A/R over 90 days creeping above 20% for two consecutive months, claims missing timely filing deadlines more than rarely, one specific payer consistently dominating the aged bucket, or a follow-up touch rate that keeps slipping as claim volume grows.
When those signals show up together, it usually means the tracking workflow hasn’t kept pace with payer mix or claim volume — not that any single staff member is falling behind on their own. At that point, practices generally look for support that treats A/R follow-up as a payer-segmented, deadline-driven discipline rather than a single monthly report someone skims. That’s the structure worth looking for, whichever vendor or in-house process change ends up filling the gap.
It’s an approach EON Med Solutions builds around directly. A/R follow-up, denial management, and payment posting sit inside one connected revenue cycle process. So a claim that’s aging toward a deadline gets flag and work before it becomes unrecoverable, not after. Every plan includes a dedicated RCM manager, and there are no long-term contracts — you can evaluate the fit without committing years upfront. Results vary by practice and payer mix, so the useful next step is comparing your own numbers against the benchmarks above, not taking anyone’s word for it.
If your self-assessment score above flagged more than one gap, reach out to EON Med Solutions for a walkthrough of your current aging report structure and follow-up cadence — the goal is a clear, specific list of where faster recovery is realistic for your practice, not a generic pitch.
Sources & Methodology
- Published standards/regulations: Medicare’s 12-month timely filing deadline (42 CFR § 424.44); the CAQH CORE 20-second real-time response requirement for electronic claim status (276/277), mandated under the Affordable Care Act.
- Named benchmarking framework: HFMA’s MAP Keys initiative, which defines the aged A/R percentage metric used consistently across the revenue cycle industry.
- Commonly reported industry ranges: aging bucket distribution targets, follow-up cadence, and commercial timely filing windows, compiled from multiple industry sources rather than one named study.
- Illustrative targets: the payer-level A/R distribution table, explicitly labeled as a hypothetical planning example rather than sourced data.
Actual results vary by practice, payer mix, and claim volume. Figures in this article reflect information available at the time of research. It should be verified against your own aging report and reporting system where precision matters.
Reference: eCFR — 42 CFR § 424.44, Time limits for filing claims.
Ref: CAQH CORE — Real-time response requirements for electronic claim status (276/277).
Reference: HFMA — MAP Keys, industry-standard revenue cycle KPIs.
Related Reading on EON Med Solutions
A/R Management — the broader strategy behind keeping receivables current.
Denial Management — what happens when an aged claim turns out to be a denial.
Revenue Cycle Management services — how unpaid-claims tracking fits into the full revenue cycle.
Medical Billing KPIs to Track for Practices — a deeper look at the benchmarks referenced above.


