

Patient Statement Generation for Faster Collections
Patient statement generation for faster collections is the process of preparing, validating, and delivering itemized billing statements to patients as soon as possible after insurance adjudication, so the balance still feels connected to the visit. Practices that automate this step commonly report a practical target of getting the first statement out within a few days of payment posting, rather than waiting for a monthly batch cycle. The goal is a clear, accurate statement delivered through each patient’s preferred channel — mail, email, text, or an online portal.
A payer finishes adjudicating a claim, and then the balance sits. For many practices, that balance doesn’t reach the patient’s mailbox for weeks, and by then the visit is a distant memory and the bill feels unexpected. This guide covers how patient statement generation actually works, the benchmarks that separate a healthy collections process from a struggling one, and the design and delivery choices that get statements paid faster. Near the end, you’ll also find a short self-assessment checklist so you can score your own practice’s statement process against these numbers.
Key Numbers Cheat Sheet
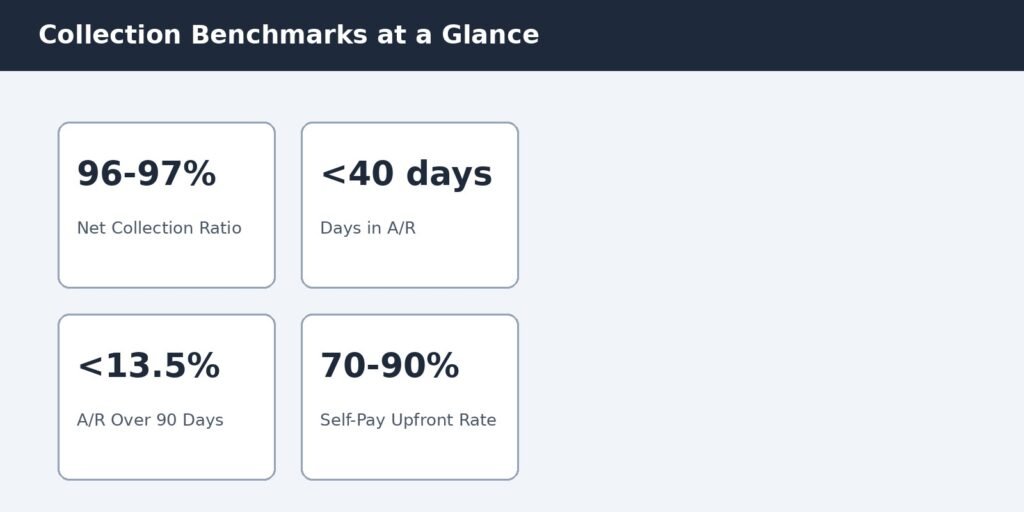
Each figure below is unpacked with a worked example later in this guide — bookmark this table as a quick reference rather than trying to absorb it all now. Review cadence assumes a practice already tracking these metrics in its reporting workflow.
| Metric | Practical Target/Range | Review Frequency | Primary Source |
| Net collection ratio | 96–97% | Monthly | MGMA-reported industry benchmark¹ |
| Days in A/R | Under 30–40 days | Weekly/Monthly | Commonly reported (MGMA/HFMA) range² |
| A/R over 90 days | Under ~13.5% (commonly cited 12–15%) | Monthly | MGMA-reported industry benchmark¹ |
| Self-pay upfront collection rate | 70–90% | Monthly | Commonly reported industry range |
| Self-pay-after-insurance collection rate | Above 55% (has trended down from ~76% in 2020) | Quarterly | Crowe RCA Benchmarking Analysis (as reported) |
| Statement cycles before write-off | 3–4 statements over ~60–75 days | Per cycle | Commonly reported industry practice |
| POS / card-on-file collection lift | 20–30% improvement | Annual review | Commonly reported industry range |
¹ MGMA-reported industry benchmark = a figure published in MGMA benchmarking data or member surveys. ² Commonly reported range = a figure cited consistently across multiple industry sources rather than one single named study. Illustrative target = a practical planning figure, not a mandate from any standards body.
What Patient Statement Generation Actually Covers?
Patient statement generation is the step in revenue cycle management (RCM) that turns an adjudicated claim into a bill the patient can understand and pay. It starts once the payer has finished processing a claim and posted its payment, and it ends when the statement reaches the patient through mail, email, text, or a patient portal. In between, someone — a person or a system — has to validate the patient’s responsibility amount, confirm it matches the explanation of benefits, format it into a readable document, and route it to the right delivery channel.
Done manually, this step is where a lot of practices lose time. Batching statements once a month, printing them in-house, and mailing them creates a lag between when a patient’s responsibility is known and when they actually see a bill. Automated statement generation removes most of that lag by triggering the statement the moment a balance is confirmed, instead of waiting for the next scheduled print run.
What Slow, Confusing Statements Cost a Practice?
The financial impact of a slow statement process is larger than most practices assume. A HIMSS Analytics survey, cited widely in RCM benchmarking commentary, found that over half of patients take longer than three months to pay a medical bill, and only about a third of patient balances get collected in full. Separately, benchmarking work from Crowe has tracked self-pay-after-insurance collection rates falling from roughly 76% in 2020 to under 55% today, a trend tied partly to rising patient financial responsibility.
Confusion is a major driver of that gap. A statement with unexplained codes, no clear due date, or a total that doesn’t match what the patient remembers from their visit invites a phone call instead of a payment — or worse, it gets set aside and forgotten. Every week that a balance sits unbilled or unclear is a week further from the visit, and self-pay collections research consistently shows that response rates drop the longer that gap grows.
How Automated Statement Generation Works?
A modern statement workflow runs in a fairly consistent sequence: payment posting confirms the patient’s remaining balance, the system cross-checks it against the explanation of benefits, a statement is formatted with itemized charges and dates of service, and it’s routed through the patient’s preferred channel — often within 24 to 72 hours of payment posting. Follow-up reminders and payment-plan offers can trigger automatically on a set schedule after that first touch.
Manual vs. Automated Statement Generation
| Factor | Manual / Batch Process | Automated Process |
| Time from payment posting to statement | Days to weeks (batched) | Typically 24–72 hours |
| Delivery channels | Usually mail only | Mail, email, text, portal |
| Follow-up reminders | Manual, inconsistent | Rule-based, consistent |
| Staff time per statement | Higher (printing, stuffing, mailing) | Lower (exception handling only) |
| Cost per statement (directional) | Higher — print, postage, labor | Lower — largely automated |
| Error correction | Reactive, after complaints | Validated before send |
Building a Statement Cycle That Actually Collects
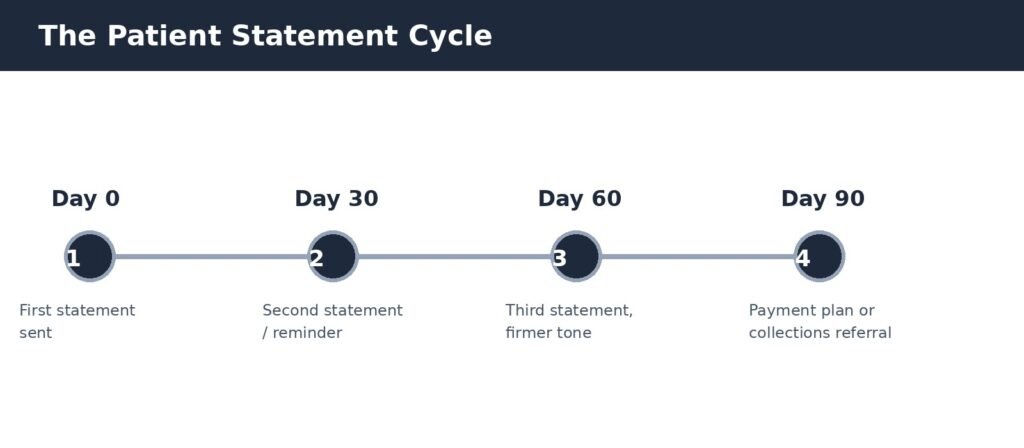
A statement cycle is the sequence of touchpoints a practice uses to move a balance to zero. A commonly used structure sends the first statement at day zero, a second reminder around day 30 with a firmer tone, a third statement near day 60, and a final notice around day 75 to 90 before the account moves to a payment plan offer or collections referral. Most billing-industry commentary reports that sending more than three or four statements rarely improves response rates — patients who haven’t responded by then typically won’t respond to a fifth or sixth notice either.
That final-notice stage is also where a payment plan offer tends to work best. Practices that let patients enroll in an installment plan directly from the statement or portal — rather than requiring a phone call to set one up — commonly report better follow-through than those offering a single all-or-nothing balance.
Worked Example: Statement Cycle Timeline
Formula: total cycle length = number of statements × interval between statements. Example: 3 statements sent at 30-day intervals starting at day 0 (day 0, day 30, day 60) closes the standard cycle by day 60, with a final notice at day 75–90 if still unpaid — roughly 75 to 90 days from first bill to collections referral.
Statement Design and Clarity: What Gets Patients to Pay
Design choices influence payment speed as much as delivery timing does. A statement that lists dates of service, a plain-language description of each charge, the insurance adjustment already applied, and a single clear balance due tends to generate fewer confused phone calls and faster payment than one built around raw billing codes. Upfront cost estimates, which the No Surprises Act now requires for uninsured or self-pay patients in many situations, also help by reducing the shock factor when the final statement arrives.
Practices working to reduce statement-related confusion often pair clearer formatting with a review of denial management practices, since a statement built on a clean, non-denied claim is inherently easier for a patient to understand.
Multi-Channel Delivery: Print, Email, Text, and Portal
Delivery channel affects both speed and cost. Print-and-mail statements remain necessary for some patients, but they’re the slowest and most expensive channel once postage and handling are factored in. Email and text delivery, paired with a secure link to a patient portal for viewing and paying, typically shortens the time between delivery and payment because the patient can act immediately instead of waiting for mail and then finding a stamp or a checkbook.
A blended approach — offering print, email, text, and portal, and defaulting each patient to their stated preference — tends to outperform a single-channel strategy. Practices that only mail paper statements and wait tend to see meaningfully lower response rates than those running a coordinated, multi-channel cycle.
Keeping Multi-Channel Delivery HIPAA-Compliant
Adding email and text channels raises a compliance question, not just a logistics one. The HIPAA Security Rule treats encryption as an addressable safeguard rather than a flat mandate, which means a practice can use unencrypted email or SMS only after warning the patient of the risk and documenting that they still prefer that channel. A secure patient portal link sidesteps that consent step entirely, which is one more reason portals tend to outperform plain email for anything beyond a payment reminder.
Two related details are easy to overlook. First, statement timelines and required content can vary by state, so a cadence that’s compliant in one location may need adjusting in another — check state billing rules alongside federal ones. Second, non-profit hospitals have separate financial-assistance obligations under Section 501(r) of the tax code, which can affect when and how a statement is sent to a patient who may qualify for charity care. Neither point replaces legal advice specific to your practice, but both are worth confirming with counsel before finalizing a multi-channel statement policy.
Measuring Success: The KPIs That Matter
Two metrics anchor most statement-related performance reviews: days in accounts receivable (A/R) and net collection ratio. Days in A/R measures how long it takes, on average, to collect payment after billing. Net collection ratio measures how much of the money actually owed to the practice — after contractual write-offs — gets collected.
The three calculations below are the ones practice managers most often get tripped up on. Each uses numbers you likely already have on hand, and none takes more than a minute or two to run for your own practice.
Worked Example: Days in A/R
Formula: Days in A/R = Total Accounts Receivable ÷ Average Daily Charges. Example: a practice with $300,000 in total A/R and $10,000 in average daily charges has 300,000 ÷ 10,000 = 30 days in A/R — inside the commonly reported 30-to-40-day target range.
Worked Example: Net Collection Ratio
Formula: Net Collection Ratio = Payments ÷ (Charges − Contractual Adjustments) × 100. Example: $190,000 collected against $220,000 in charges with $20,000 in contractual adjustments gives 190,000 ÷ (220,000 − 20,000) = 95% — just under the 96–97% industry-cited benchmark, a signal worth investigating rather than an emergency.
Worked Example: Self-Pay Upfront Collection Rate
Formula: Upfront Collection Rate = Amount Collected at Time of Service ÷ Total Self-Pay Amount Due × 100. Example: collecting $8,000 at check-in against $10,000 total self-pay responsibility gives 8,000 ÷ 10,000 = 80%, within the commonly reported 70–90% range.
Each formula is simple once you know it. If one of your own numbers falls outside its target range, treat that as the metric to investigate first — not a reason to overhaul the entire statement process at once.
Why a Blended Average Can Hide a Real Problem?
A practice-wide collection rate can look healthy while one service line quietly underperforms. The table below is illustrative — a planning example, not data pulled from a named benchmarking source — but it shows how a blended figure can mask a struggling segment.
Illustrative Self-Pay Collection Rate by Service Line (Hypothetical Example)
| Service Line | Hypothetical Rate | Note |
| Primary care | ~88% | Smaller balances, routine visits |
| Dermatology / cosmetic | ~90% | Often collected upfront |
| Specialty / surgical | ~80% | Larger balances, more disputes |
| Behavioral health | ~62% | Recurring visits, sensitive balances |
| Blended practice average | ~85% | Masks the behavioral health gap |
Illustrative scenario (not an actual client record): a multi-specialty group reports an 85% blended self-pay collection rate and assumes performance is on target. A service-line breakdown shows behavioral health sitting closer to 62%, well below the practical 70–90% range, hidden by stronger performance elsewhere. The specific percentages above are a constructed example built to demonstrate this methodology point, not figures pulled from any study or client record. Actual figures vary by practice and payer mix; readers should verify against their own data source.
How to Use These Numbers Correctly?
A benchmark is only useful compared like-for-like. Comparing a primary care practice’s self-pay collection rate to a surgical specialty’s, or comparing a small clinic’s days in A/R to a large multi-location group’s, usually produces a misleading conclusion. Match segment, payer mix, practice size, and reporting period before drawing conclusions from any single figure.
A single missed benchmark in one month is a signal to investigate, not a verdict on the whole practice. Look for a pattern across two or three reporting periods, and check whether one segment or payer is driving the shift, before assuming the entire process needs an overhaul.
Timeframe to Improvement
Treat these as directional ranges rather than promises — where you land depends on current process maturity, payer mix, and how much of the statement workflow is already automated versus manual.
| Change Made | Partial Improvement | Fuller Improvement |
| Switch to automated statement generation | 2–4 weeks | 2–3 billing cycles |
| Add multi-channel delivery (email/text/portal) | 1 statement cycle | 3–4 statement cycles |
| Redesign statement clarity/formatting | 1 statement cycle | 2–3 statement cycles |
| Add point-of-service / card-on-file collection | 30–60 days | 90–120 days |
Quick Summary
- Aim to send the first statement within days of payment posting, not on a once-a-month batch.
- Use plain-language, itemized statements — clarity reduces confused calls and speeds payment.
- Offer mail, email, text, and portal delivery, defaulting to each patient’s stated preference.
- Track days in A/R (industry-cited target: under 30–40 days) and net collection ratio (widely used target: 96–97%).
- Cap statement cycles at three to four touches before moving to a payment plan or collections referral.
- Check performance by service line, not just the blended average — one segment can hide a real gap.
Self-Assessment Checklist
Answer yes or no to each question, then use the scoring guide below.
- Do you send the first patient statement within a week of payment posting?
- Are your statements itemized in plain language rather than raw billing codes?
- Do you offer at least three delivery channels (mail, email, text, or portal)?
- Is your days in A/R currently under 40 days?
- Is your net collection ratio at or above 95%?
- Is your A/R over 90 days below roughly 15%?
- Do you cap statement cycles at three to four touches before escalation?
- Do you review collection performance by service line, not just the practice-wide average?
- Do you collect copays or self-pay amounts at time of service?
- Do you have a documented, consistent statement cycle (not ad hoc mailing)?
Scoring guide:
- 8–10 checks: your statement process is already working in your favor — the job now is monitoring, not overhauling.
- 4–7 checks: you’ve got a workable foundation, though a few gaps are likely costing you collections — start with the “no” answers.
- 0–3 checks: the statement and collections workflow probably needs a ground-up review before small fixes will move the needle.
Expert Opinion
Faster patient collections rarely come down to one fix. They come from shortening the time between claim adjudication and the first statement, making that statement genuinely easy to read, and giving patients a channel they’ll actually use to pay it. Sourcing varies across these figures: net collection ratio and A/R-aging numbers are commonly cited MGMA benchmarks, the self-pay-after-insurance trend is drawn from Crowe’s benchmarking research, and the service-line breakdown table is an illustrative planning example rather than a published standard.
None of these numbers is a guarantee for any individual practice — payer mix, specialty, and patient population all shift what’s realistic. But a practice that automates statement generation, tightens its cycle to three or four touches, and checks performance by segment instead of relying on a blended average is working from a stronger position than one that mails a single monthly batch and hopes.
The direction of travel is worth noting, too. The shift underway across the industry is away from monthly batch mailing and toward statement generation triggered directly by payment posting, with multi-channel delivery treated as a default rather than an upgrade. Practices that adopt that baseline now are likely to find the benchmarks in this guide easier to hit as patient-facing billing technology keeps maturing.
— EON Med Solutions RCM Team
Frequently Asked Questions
What is patient statement generation?
It’s the process of preparing and delivering a billing statement to a patient after insurance has processed their claim, showing the remaining balance they owe based on the explanation of benefits.
What is a good turnaround time for sending a patient statement?
A commonly cited practical target is within a few days to about a week of payment posting. Waiting a full month, as many manual batch processes do, is generally considered too slow.
What is a good self-pay collection rate?
Industry sources commonly report an upfront self-pay collection rate of 70–90% as a widely used benchmark, though this varies by specialty, balance size, and whether a practice collects at time of service.
How many statements should a practice send before referring to collections?
Most industry guidance points to three or four statements over roughly 60–90 days. Additional statements beyond that rarely change patient response rates.
What’s the difference between a patient statement and an Explanation of Benefits (EOB)?
An EOB comes from the insurance company and explains how a claim was processed. A patient statement comes from the provider and is the actual bill for the remaining balance.
Does statement design really affect how fast patients pay?
Yes. Statements with plain-language descriptions, clear due dates, and a single visible balance tend to generate fewer confused calls and faster payment than statements built around raw billing codes.
Which delivery channel gets patients to pay fastest?
No single channel works for everyone, but pairing email or text with a secure online portal generally shortens the time between delivery and payment compared with mail-only delivery.
How does denial management affect patient statements?
Claims that get denied and later corrected can generate a follow-up statement with a changed balance, which confuses patients. Managing denials earlier in the process — before a statement goes out — keeps balances accurate the first time.
What is a good net collection ratio?
A commonly reported industry benchmark for net collection ratio is 96–97%, with a figure at or below 95% generally treated as a signal to investigate underlying claims and collections processes.
When to Consider Professional Support?
Statement design and delivery can only fix so much on their own. A handful of signals usually mean the underlying process, not just the statement itself, needs outside help: days in A/R climbing past 40 for two consecutive cycles, net collection ratio sitting below 95% for a quarter, a growing share of A/R stuck past 90 days, front-desk staff spending more time on billing calls than patient care, or no consistent multi-channel delivery in place at all.
When those signals show up together, it’s usually a sign that internal billing capacity has hit its limit rather than a signal that any single tactic failed. At that point, practices generally look for outside support that combines statement generation and delivery with the earlier stages of the revenue cycle — clean claim submission, payer-specific denial handling, and transparent reporting — so statements reflect accurate, appeal-adjusted balances rather than figures that later change. That’s the structure worth looking for, whichever vendor or in-house hire ends up filling the gap.
It’s an approach EON Med Solutions builds around directly: denial management is part of the core revenue cycle process, not an add-on, so payer-specific appeals and denial patterns get caught before a balance ever reaches a patient statement. Every plan includes a dedicated RCM manager, and there are no long-term contracts — you can evaluate the fit without committing years upfront. Results vary by practice and payer mix, so the useful next step is comparing your own numbers against the benchmarks above, not taking anyone’s word for it.
If your self-assessment score above flagged more than one gap, reach out to EON Med Solutions for a walkthrough of your current statement cycle, delivery channels, and denial trends — the goal is a clear, specific list of where faster collection is realistic for your practice, not a generic pitch.
Sources & Methodology
- Published standards/definitions: No Surprises Act Good Faith Estimate requirements for uninsured/self-pay patients (CMS.gov); HIPAA Security Rule encryption and patient-communication safeguards (HHS.gov).
- Named benchmarking data: MGMA-reported net collection ratio and A/R-aging benchmarks; Crowe RCA Benchmarking Analysis on self-pay-after-insurance collection trends (as reported in secondary industry sources).
- Commonly reported industry ranges: days in A/R, self-pay upfront collection rate, statement cycle length (including the widely repeated guideline that response rates rarely improve after a third or fourth statement), and POS collection lift — compiled from multiple industry sources rather than one named study.
- Illustrative targets: the service-line collection rate table, explicitly labeled as a hypothetical planning example rather than sourced data.
Actual results vary by practice, specialty, payer mix, and reporting period. Figures in this article reflect information available at the time of research and should be verified against your own practice management or reporting system where precision matters. State billing regulations and non-profit financial-assistance requirements (Section 501(r)) also vary and should be confirmed with counsel.
Reference: CMS — No Surprises Act, Good Faith Estimates and patient billing rights.
Ref: MGMA — Collection challenges growing for medical practices.
Reference: HHS Office for Civil Rights — FAQ: Does the Security Rule allow sending ePHI in an email?.
Related Reading on EON Med Solutions
Revenue Cycle Management services — how statement generation fits into the broader revenue cycle.
A/R Management — reducing aged accounts receivable beyond the statement cycle.
Medical Billing KPIs to Track for Practices — a deeper look at the benchmarks referenced above.
Medical A/R Days Reduction Strategies — tactics for shortening collection timelines.


