

Understanding Payer-Specific Claim Submission Rules
Payer-specific claim submission rules are the formatting, documentation, coverage, and modifier requirements an individual payer layers on top of the national HIPAA claim standard, and they explain why the exact same clean, correctly coded claim can be accepted by one payer and rejected by another. Every claim starts from the same base — the ASC X12 837 transaction and its NUCC data set — but each payer’s companion guide, coverage policies, and contract terms determine what “complete and correct” actually means for that specific payer.
It’s a common source of frustration for billing teams: Understanding payer-specific claim submission rules, a claim that processes cleanly with one payer bounces back from another, even though nothing about the coding or documentation changed. The explanation almost always traces back to the same thing — a rule specific to that payer that the practice’s process wasn’t built to catch. This guide covers where the national claim standard ends and payer-specific variation begins, the tools that document those differences, and the benchmarks that show how much payer-specific gaps actually cost. Near the end, you’ll find a short self-assessment checklist to score your own process against these numbers.
Key Numbers Cheat Sheet
Each figure below is unpacked further in this guide — bookmark this table as a quick reference rather than trying to absorb it all now.
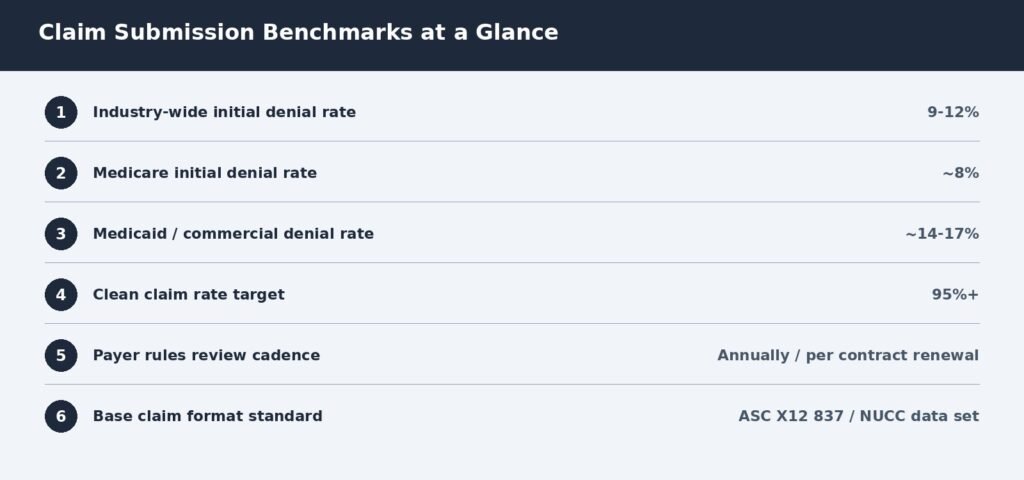
| Metric | Practical Target/Range | Review Frequency | Primary Source |
| Industry-wide initial denial rate | 9–12% | Monthly | Commonly reported industry range¹ |
| Medicare initial denial rate (typically lowest) | Roughly 8% | Monthly, by payer | Commonly reported industry range¹ |
| Medicaid / commercial denial rate (typically highest) | Roughly 14–17% | Monthly, by payer | Commonly reported industry range¹ |
| Clean claim rate | 95% or higher | Monthly | Commonly reported industry range¹ |
| Payer rules / companion guide review cadence | At least annually, or at each contract renewal | Per payer | Commonly reported industry practice |
| Base electronic claim format | ASC X12 837 / NUCC uniform data set | Fixed — not payer-adjustable | Published national standard² |
¹ Commonly reported industry range = a figure cited consistently across multiple industry sources rather than one controlled study. ² Published national standard = the fixed baseline data set every payer builds its own rules on top of, not itself a payer-specific figure.
What “Payer-Specific” Actually Means?
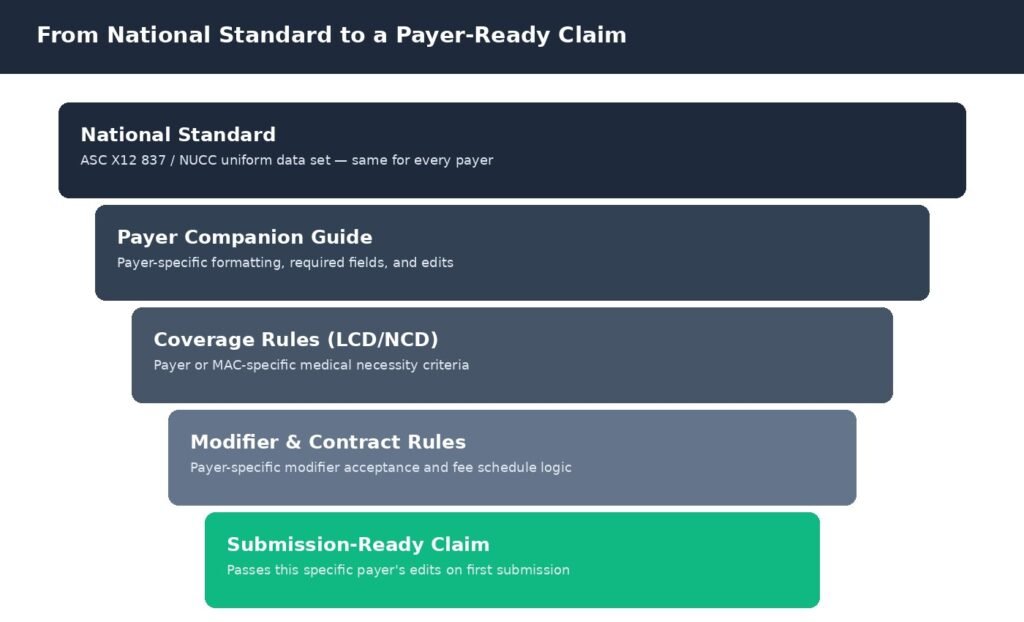
Every electronic claim in the United States is built on the same foundation: the ASC X12 837 transaction standard, mandated under HIPAA, with its data elements defined by the NUCC uniform data set for professional claims. That baseline doesn’t vary by payer — a Medicare claim and a small regional commercial claim use the identical underlying transaction structure.
Per CMS’s own fact sheet on the 837P and Form CMS-1500, that standard is what makes one processing system capable of handling both paper and electronic claims consistently. What varies is everything layered on top of that baseline: which fields a specific payer treats as required versus optional, which modifiers it accepts in which combinations, which diagnoses justify a given service, and which format it expects documentation to arrive in.
The National Baseline vs. the Payer Overlay
It helps to think of every submitted claim as passing through layers, not a single check. The base layer is fixed and universal. Every layer after that is where a specific payer’s own rules — its companion guide, its coverage policies, its contract terms — determine whether the claim actually gets accepted, not just whether it’s technically well-formed.
Where Payers Diverge From the Baseline?
| Layer | What Varies by Payer | Documented In |
| Formatting & required fields | Which fields are mandatory, file structure, attachment formats | Payer companion guide |
| Coverage & medical necessity | Which diagnoses justify which services, regionally for Medicare | LCD/NCD (Medicare); payer medical policy (commercial) |
| Modifiers & code combinations | Which modifiers are accepted, required, or preferred for a service | Payer billing guidelines |
| Submission channel | Portal-only, clearinghouse-only, or paper-required for certain claim types | Payer provider manual |
Local Coverage Determinations: The Same Service, Different Rules by Region
Medicare illustrates payer-specific variation in its most literal form: coverage for the exact same service can differ by geography, because Local Coverage Determinations (LCDs) are issued by individual Medicare Administrative Contractors (MACs), not CMS centrally, for services where no national coverage policy exists.
Per CMS’s own guidance on Local Coverage Determinations, an LCD sets the specific diagnosis codes and clinical conditions under which a MAC will consider a service medically necessary within its jurisdiction. A service billed with a diagnosis that satisfies one MAC’s LCD can be denied for medical necessity by a neighboring MAC with a stricter local policy — even though the clinical documentation and coding are identical.
Commercial payers run a parallel version of the same problem through their own medical policies, which function similarly to LCDs but aren’t publicly indexed the way the CMS Medicare Coverage Database is. That’s exactly why a payer-specific reference matters more than a general coding reference: the general reference tells you a code exists, not whether this specific payer will pay for it under these specific circumstances.
Building a Payer Rules Reference
The practical fix is building — and actually maintaining — a documented reference per payer: timely filing window, required modifiers, submission channel, and any known coverage restrictions specific to that payer’s high-volume services. This is the same discipline as maintaining a companion-guide library, just organized for a billing team rather than an EDI developer.
A payer rules reference works best as a living document, not a one-time project — it needs the same ongoing attention as tracking unpaid claims across payers, since payer rules change on their own schedule and a reference that’s a year out of date can be more dangerous than no reference at all if staff trust it blindly.
Rejection vs. Denial: Why the Distinction Matters Here?
Payer-specific rule gaps overwhelmingly produce rejections, not denials — and the difference matters for how a practice should respond. A rejection happens before the payer’s adjudication system ever reviews the claim; the clearinghouse or the payer’s front-end intake system catches a formatting or data problem and returns the claim, usually within a day or two, with no appeal required. A denial happens after adjudication, when the payer has actually reviewed the claim and decided not to pay it — which typically requires a formal appeal, not just a correction.
Confusing the two wastes time: treating a rejection like a denial means routing a simple formatting fix through an appeals process built for medical-necessity disputes, while treating a denial like a rejection means resubmitting an unchanged claim that will bounce right back for the same substantive reason.
Measuring the Impact of Payer-Specific Gaps
The three calculations below use figures most billing teams already have available. None takes more than a few minutes to run against your own claims data.
Worked Example: Blended vs. Payer-Specific Denial Rate
Formula: Blended Denial Rate = Σ(Payer Claim Volume × Payer Denial Rate) ÷ Total Claim Volume. Example: a practice with 40% Medicare claims (8% denial rate), 35% commercial (14%), and 25% Medicaid (17%) has a blended rate of (0.40×8) + (0.35×14) + (0.25×17) = 3.2 + 4.9 + 4.25 ≈ 12.4% — a single number that conceals the fact any one payer’s rate could be twice the others.
Worked Example: Administrative Cost of Payer-Specific Rejections
Formula: Monthly Rework Cost = Rejected Claims per Month × Average Cost to Correct and Resubmit. Example: 40 claims rejected monthly for payer-specific formatting issues, at a commonly reported administrative cost of roughly $25 to $60 per reworked claim, comes to $1,000–$2,400 per month in avoidable staff time — the kind of recurring cost that a documented payer rules reference is specifically built to prevent.
Worked Example: Payer Rules Coverage Gap
Formula: Coverage Gap = Payers Without a Documented Rules Reference ÷ Total Payers Billed × 100. Example: a practice bills 15 distinct payers but has an up-to-date rules reference for only 9 of them, giving (15 − 9) ÷ 15 = 40% — meaning nearly half of the practice’s payer relationships have no documented reference at all, regardless of how well the other 9 are managed.
Why a Blended Denial Rate Can Hide a Real Problem?
A practice-wide denial rate sitting comfortably inside the commonly reported 9–12% range can still conceal one payer performing far worse than the others. The table below is a hypothetical construct built to illustrate that methodology point — not figures pulled from any study or client record.
Illustrative Denial Rate by Payer (Hypothetical Example)
| Payer | Hypothetical Denial Rate | Note |
| Medicare | ~7% | Standardized rules, well-documented |
| Major commercial payer A | ~10% | Generally standardized |
| Major commercial payer B | ~13% | Frequent modifier-related rejections |
| Smaller regional payer | ~24% | No documented rules reference on file |
| Blended practice average | ~11% | Masks the regional-payer gap entirely |
Illustrative scenario (not an actual client record): a practice’s blended denial rate sits at a reasonable 11%, comfortably inside the commonly reported range, and the practice assumes its process is under control. A payer-level breakdown shows one smaller regional payer denying claims at roughly 24% — more than double the blended figure — because no one ever built a rules reference for that specific payer’s modifier and documentation requirements. The specific figures above are constructed to demonstrate this point, not sourced data. Actual figures vary by practice and payer mix; verify against your own denial report segmented by payer.
How to Use These Numbers Correctly?
A benchmark here is only useful compared like-for-like. A practice billing mostly Medicare and a few large, standardized commercial payers will naturally show a healthier blended denial rate than one with several smaller regional payers layered in, and comparing the two directly produces a misleading conclusion. Match payer mix and claim volume before drawing conclusions from a single figure.
One payer’s bad month is a signal to investigate, not a verdict on the whole process. Look for a pattern across two or three reporting periods, and check whether one payer’s specific rules — not the general claims process — is driving the shift before assuming everything needs to change.
Timeframe to Improvement
Consider these starting estimates rather than fixed rules — the real timeline shifts with payer mix, claim volume, and how much rules documentation your practice has already built.
| Change Made | What It Takes | Timeframe | Key Constraint |
| Build a rules reference for top 5 payers by volume | Review companion guides + document findings | 2–3 weeks | Some payers don’t publish guides publicly |
| Add payer-specific edits to claim scrubbing | Clearinghouse or software rule configuration | 2–4 weeks | Vendor capability and rule-update cadence |
| Review LCDs for top billed services | MCD search + documentation per service line | 1–2 weeks | LCDs vary by MAC jurisdiction, not just nationally |
| Establish an annual payer-rules review cycle | Calendar cadence + staff ownership assignment | 1 cycle to establish; ongoing after | Requires consistent staff time, not just a policy |
Quick Summary
- Every claim starts from the same ASC X12 837/NUCC baseline — payer-specific rules are what’s layered on top, not the base standard itself.
- Local Coverage Determinations mean Medicare coverage for the same service can genuinely differ by region — check the MAC-specific LCD, not just the code.
- Rejections and denials need different responses — a rejection is a formatting fix, a denial usually requires a formal appeal.
- Track denial rate by payer, not just blended — one under-documented payer can run at double the practice-wide average.
- Build and actually maintain a rules reference per payer — a stale reference can be more dangerous than none if staff trust it blindly.
- Review payer rules at least annually or at contract renewal — companion guides and LCDs both change on their own schedule.
Self-Assessment Checklist
Answer yes or no to each question, then use the scoring guide below.
- Do you know your denial rate broken out by payer, not just the blended total?
- Can you name your highest-denial payer and roughly why?
- Do you have a documented rules reference (formatting, modifiers, timely filing) for your top payers?
- Do you check the region-specific LCD before billing a service with known coverage restrictions?
- Does your claim scrubbing apply payer-specific edits, not just generic formatting checks?
- Do staff correctly distinguish a rejection from a denial when deciding how to respond?
- Is your payer rules reference reviewed at least annually or at contract renewal?
- Do you know which payers require portal-only or paper-only submission for certain claim types?
- Is your clean claim rate at or above roughly 95%, or do you know roughly where it stands?
- Do you have a documented reference for at least most of the payers you regularly bill?
Scoring guide:
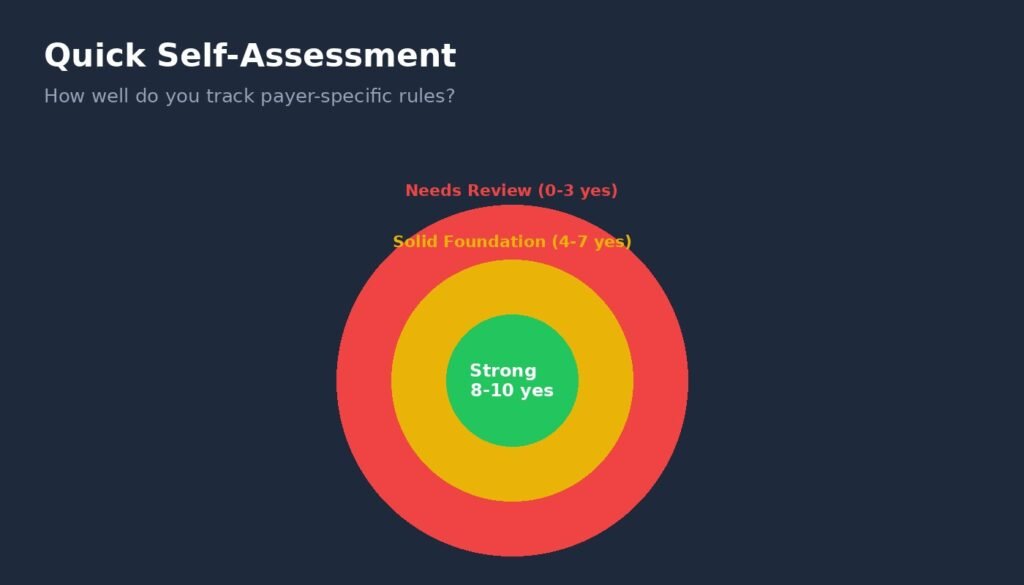
- Landing at 8–10 means your practice is already tracking payer-specific rules well — keep the reference updated as payers change policy.
- Landing at 4–7 means you’re catching some payer quirks but missing others — the “no” answers show where denials are likely originating.
- Landing at 0–3 means payer-specific rules aren’t tracked in any structured way yet, which is a common and fixable source of denials.
Expert Opinion
Here’s something that catches even well-run practices off guard: a claims process can be strong on every general measure — clean documentation, accurate coding, consistent charge capture — and still get blindsided by one specific payer’s rejection rate, because “general” was never the actual requirement. Every payer is quietly grading against its own rubric, and a claims process built only to a national standard is, by definition, only half-built.
The sourcing here splits the same way: the ASC X12 837/NUCC baseline and Medicare’s LCD process are fixed, published national frameworks, while denial-rate ranges and review cadence come from commonly reported industry figures rather than a single controlled study. None of it is guaranteed for any one practice — payer mix and claim volume both change what’s realistic.
This connects directly to the rest of the revenue cycle, not just claim submission. A claim that clears a payer’s formatting rules but still gets denied for medical necessity ends up right back in the unpaid-claims worklist, and a claim that’s technically clean but hits an unfamiliar coordination-of-benefits rule generates the same rework either way. Understanding payer-specific rules is the upstream habit that keeps claims out of every downstream process this series has covered — posting, tracking, and cash flow all get easier when fewer claims arrive there in the first place.
— EON Med Solutions RCM Team
Frequently Asked Questions
What are payer-specific claim submission rules?
They’re the formatting, documentation, coverage, and modifier requirements an individual payer applies on top of the national ASC X12 837/NUCC claim standard, which explains why the same clean claim can be accepted by one payer and rejected by another.
What is a good denial rate for a specific payer?
Industry sources commonly report roughly 8% for Medicare on the lower end and 14–17% for Medicaid and some commercial payers on the higher end, with a practice-wide blended target of 9–12%. Comparing a single payer’s rate to the blended target rather than to its own peer range can be misleading.
What is a Local Coverage Determination (LCD)?
It’s a coverage policy issue by an individual Medicare Administrative Contractor (MAC) determining. Whether a service cover as medically necessary within that MAC’s jurisdiction. Which means coverage for the identical service can differ by region.
What’s the difference between a claim rejection and a claim denial?
A rejection happens before adjudication — a formatting or data error stops the claim before the payer ever reviews it, and it just needs correction and resubmission. A denial happens after the payer reviews the claim and decides not to pay it, which typically requires a formal appeal.
What is a companion guide?
A payer-specific supplement to the national ASC X12 837 implementation guide that documents exactly what that payer requires — which fields are mandatory, which codes it accepts, and how it expects data formatted — beyond the national baseline.
How often should payer-specific rules be reviewed?
A commonly reported practice is at least annually, or whenever a payer contract renews, since companion guides, coverage policies, and modifier rules all change on their own schedule independent of the national claim standard.
Do commercial payers have something equivalent to Medicare’s LCDs?
Yes, generally in the form of payer-specific medical policies, though they aren’t centralize in a public database the way Medicare’s Local Coverage Determinations are searchable through the CMS Medicare Coverage Database.
Why can a claim be clean and still get rejected?
“Clean” at the national-standard level means the claim is well-form under ASC X12 837 rules. A specific payer can still reject it for failing a rule layered on top of that baseline — a required field that payer treats as mandatory, a modifier combination it doesn’t accept, or a submission channel it requires for that claim type.
When to Consider Professional Support?
A better internal reference and more careful scrubbing can only close so much of the gap. A handful of signals usually mean the underlying process needs outside help: one or two payers consistently denying at meaningfully higher rates than the rest, no documented rules reference for a growing list of payers, staff regularly unsure whether a rejection needs correction or an appeal, or LCD-related medical necessity denials that keep recurring for the same service.
When those signals show up together, it usually means payer-specific knowledge has been living in individual staff members’ heads rather than in a documented, maintained reference. Which means it walks out the door when that person does. At that point, practices generally look for support that treats payer-specific rule tracking. As a standing discipline connected to the rest of the revenue cycle, not a one-time onboarding task. That’s the structure worth looking for, whichever vendor or in-house process change ends up filling the gap.
It’s an approach EON Med Solutions builds around directly. Payer-specific claim edits, denial management, and A/R follow-up sit inside one connected revenue cycle process. So a rejection tie to a specific payer’s rule gets correct and document, not just resubmitted and forgotten. Every plan includes a dedicated RCM manager, and there are no long-term contracts. You can evaluate the fit without committing years upfront. Results vary by practice and payer mix, so the useful next step is comparing your own numbers against the benchmarks above. Not taking anyone’s word for it.
If your self-assessment score above flagged more than one gap. Reach out to EON Med Solutions for a walkthrough of your current payer mix and denial patterns. The goal is a clear, specific list of which payer relationships need a documented rules reference first, not a generic pitch.
Sources & Methodology
- Published standards: the ASC X12 837 / NUCC uniform data set as the national baseline claim format (CMS.gov; National Uniform Claim Committee).
- Published federal process: Medicare’s Local Coverage Determination process, under which individual Medicare Administrative Contractors set region-specific coverage policy (CMS.gov).
- Commonly reported industry ranges: denial rate by payer type, clean claim rate, and administrative rework cost per rejected claim. Compiled from multiple industry sources rather than one named study.
- Illustrative targets: the payer-level denial rate table, explicitly labeled as a hypothetical planning example rather than sourced data.
Actual results vary by practice, payer mix, and specialty. Figures in this article reflect information available at the time of research. It should be verified against your own denial reporting and payer contracts where precision matters.
Reference: CMS — 837P and Form CMS-1500 Fact Sheet.
Ref: CMS — Local Coverage Determinations.
Reference: National Uniform Claim Committee (NUCC).
Related Reading on EON Med Solutions
Revenue Cycle Management services — how payer-specific accuracy fits into the broader revenue cycle.
Denial Management — what happens when a payer-specific gap turns into a denial.
A/R Management — keeping payer-specific rejections from aging into unpaid claims.
Medical Billing KPIs to Track for Practices — a deeper look at the benchmarks referenced above.


One Comment